I analyzed a random sample of 9,830 full-text research papers, uploaded to PubMed Central between the years 2016 and 2021, to check the popularity of different sampling methods and assess their correlation with the quality of research.
I used the BioC API to download the data (see the References section below).
Here’s a summary of the key findings
1. In the 596 articles that mentioned the sampling method used, probability sampling methods were more popular than non-probability sampling methods. Specifically, cluster sampling was the most used probability sampling method, and convenience sampling was the most used non-probability sampling method.
2. The 8-year trend shows that the use of non-probability sampling methods is increasing, and their popularity surpassed that of probability sampling methods in the past 2 years.
3 & 4. The use of a probability versus non-probability sampling method does not influence the quality of a research article, nor does it affect the number of citations it receives.
5. As expected, some study designs tend to use certain sampling methods more than others. For instance, a case report study always uses a non-probability sampling method, as opposed to an observational design study, which tends to use a probability sampling method.
1. Most used sampling methods overall
Out of 9,830 research papers, only 596 mentioned the sampling method used (6.06%).
Probability sampling methods (simple random sampling, systematic sampling, stratified sampling, and cluster sampling) were mentioned in 306 articles compared to 257 for non-probability sampling methods (convenience sampling, quota sampling, and network sampling).
The following table shows the number of articles that mentioned each of the 8 sampling method:
| Rank | Sampling Method | Number of mentions (in a total of 596 articles) | Percent |
|---|---|---|---|
| 1 | Convenience sampling | 208 | 34.9% |
| 2 | Cluster sampling | 132 | 22.1% |
| 3 | Simple random sampling | 84 | 14.1% |
| 4 | Multistage sampling | 71 | 11.9% |
| 5 | Stratified sampling | 67 | 11.2% |
| 6 | Systematic sampling | 57 | 9.6% |
| 7 | Network sampling | 42 | 7.0% |
| 8 | Quota sampling | 11 | 1.8% |
2. Top sampling methods over the past 8 years
The following plot shows the proportion of articles that used probability and non-probability sampling methods from 2014 to 2021:
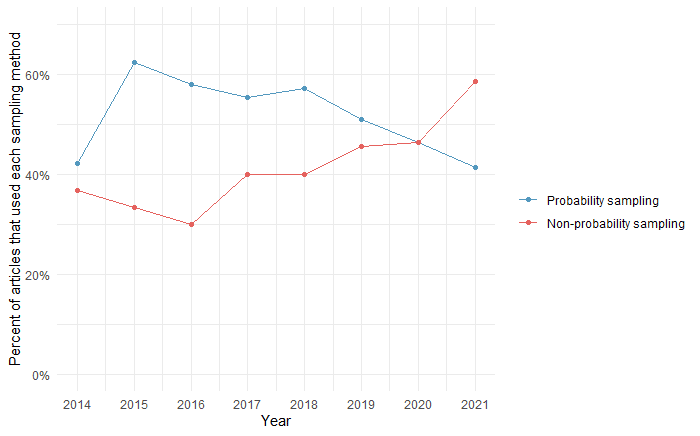
Non-probability sampling methods are getting more popular over the years, surpassing probability sampling methods in the past 2 years.
3. Is the sampling method used in a study a good indicator of its research quality?
In order to answer this question, I used a logistic regression model to predict the sampling method used (probability vs non-probability sampling) using the journal impact factor as a predictor (considering that the journal impact factor is a good proxy of research quality).
Here’s the output of the model:
| Variable | Coefficient | Standard Error | P-value |
|---|---|---|---|
| (Intercept) | -0.02233 | 0.20757 | 0.914 |
| Journal Impact Factor | 0.08974 | 0.06857 | 0.191 |
Since the coefficient of journal impact factor is not statistically significant, we can conclude that the type of sampling method used is not related to the quality of the research paper.
4. Is the citation count for an article affected by the sampling method used?
In order to answer this question, I used a logistic regression model to predict the sampling method used (probability vs non-probability sampling) using the citation count as a predictor.
Here’s the output of the model:
| Variable | Coefficient | Standard Error | P-value |
|---|---|---|---|
| (Intercept) | 0.154821 | 0.106134 | 0.145 |
| Citation Count | 0.006122 | 0.005413 | 0.258 |
Since the coefficient of citation count is not statistically significant, we can conclude that type of sampling method used is not related to the number of citations the article receives.
5. Do studies with different designs use different sampling methods?
The following plot shows the difference in the proportion of studies that used probability vs non-probability sampling methods for different study designs:
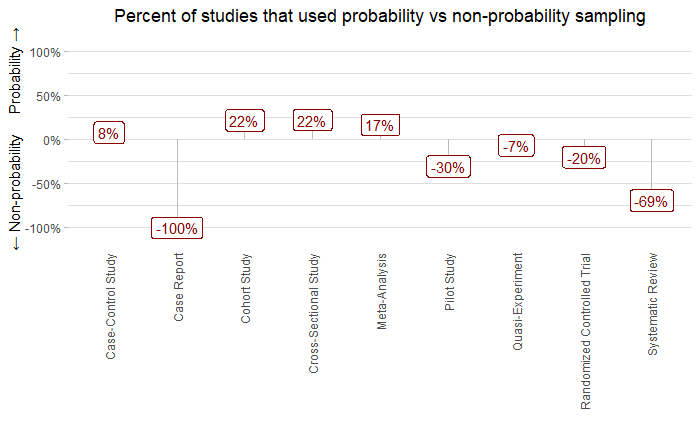
For example, 8% more case-control studies used probability sampling methods than those that used non-probability methods; and 100% of case reports used non-probability sampling methods.
Looking at this plot, we see that case reports, pilot studies, and randomized trials tend to use non-probability sampling methods, and case-control, cross-sectional, and cohort studies tend to use probability sampling methods.
References
- Comeau DC, Wei CH, Islamaj Doğan R, and Lu Z. PMC text mining subset in BioC: about 3 million full text articles and growing, Bioinformatics, btz070, 2019.