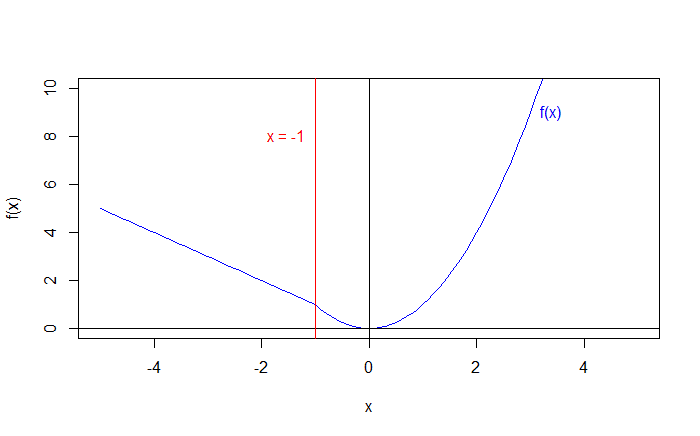
In this tutorial we are going to code the following function in R:
\(f(x) =
\begin{cases}
-x, & \text{if $x < -1$} \\
x^2, & \text{if $x \geq -1$}
\end{cases}\)
And produce the following plot:

Coding the piecewise function f(x) in R
Using if else statements
# write the piecewise function with if else statements
f = function(x) {
  if (x < -1) {
    -x
  }
  else {
    x^2
  }
}
While this code is easy to read and understand, it does not support vector inputs.
For example:
x = -5:5

print(f(x))
Output:
 [1]  5  4  3  2  1  0 -1 -2 -3 -4 -5
Warning message:
In if (x < -1) { :
  the condition has length > 1 and only the first element will be used
Which is not what we want.
One solution is to use a for loop to pass the elements of x one by one, or instead, we can vectorize f(x) by using the following code:
# vectorizing f(x)
f = Vectorize(f)

# testing the new version of f(x)
x = -5:5
print(f(x))
Output:
[1] 5 4 3 2 1 0 1 4 9 16 25
Another way to code f(x)
We can bypass the if-else statements, and code f(x) in one line:
# writing f(x) in compact form
f = function(x) {
  (x < -1) * (-x) + (x >= -1) * (x^2)
}

x = -5:5
print(f(x))

# outputs: 5  4  3  2  1  0  1  4  9 16 25
This code takes advantage of the fact that, in R:
- TRUE == 1, and
- FALSE == 0
So, when x < -1, f(x) will be: 1 * (-x) + 0 * (x^2).
And when x >= -1, f(x) will be: 0 * (-x) + 1 * (x^2).
Note: By using this form, there is no need to vectorize f(x).
Plotting the piecewise function f(x)
# plot piecewise function
x = seq(-5, 5, by = 0.1) # so, x = {-5, -4.9, -4.8, ..., 4.8, 4.9, 5}


plot(x, f(x), type = 'l', ylim = c(0,10), col = 'blue')
abline(v = 0, h = 0) # plotting the x and y axes
abline(v = -1, col = 'red') # plotting the line x = -1

# plot annotation
text(x = -1, y = 8,
     labels = "x = -1", pos = 2, col = 'red')
text(x = 3, y = f(3),
     labels = "f(x)", pos = 4, col = 'blue')
Output:
