A quick review of intervals
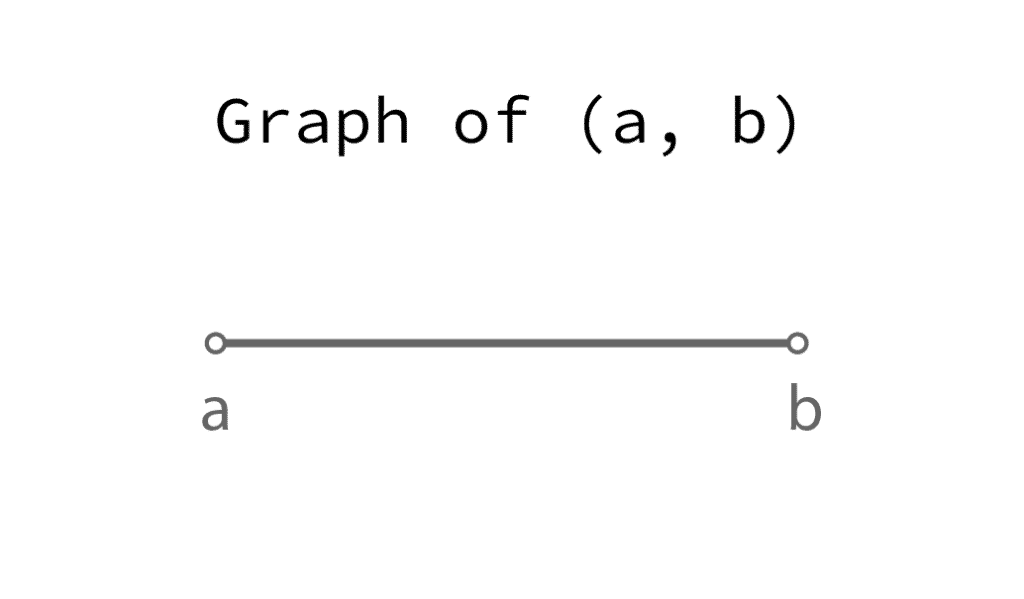
The open interval from a to b, denoted (a, b), consists of all numbers between a and b excluding the endpoints a and b.
Open circles in the graph indicate that the endpoints are excluded:
The closed interval from a to b, denoted [a, b], consists of all numbers between a and b including the endpoints a and b.
Solid circles in the graph indicate that the endpoints are included:

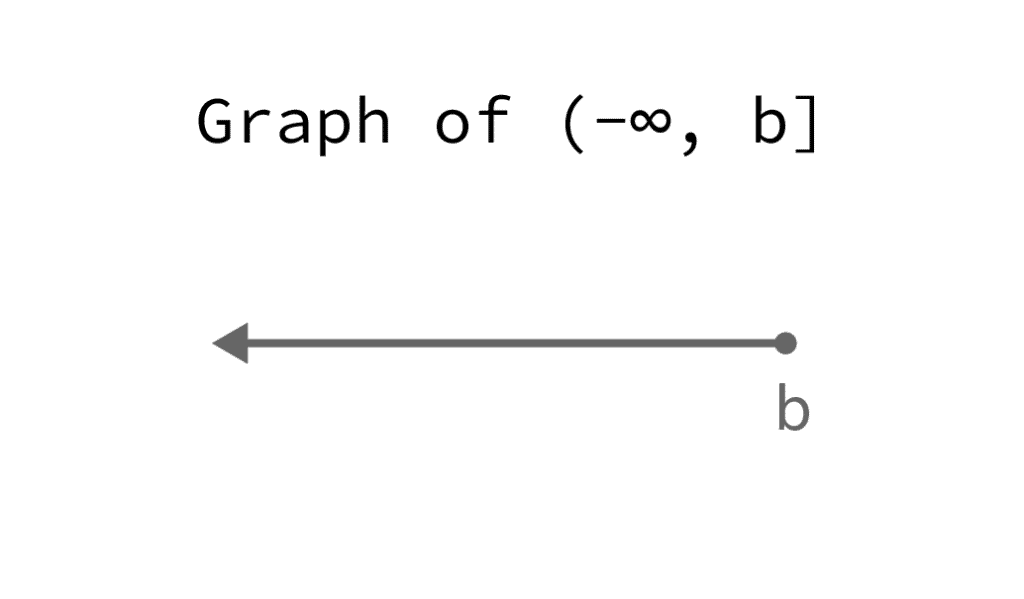
The symbol -∞ indicates that the interval extends indefinitely to the left:
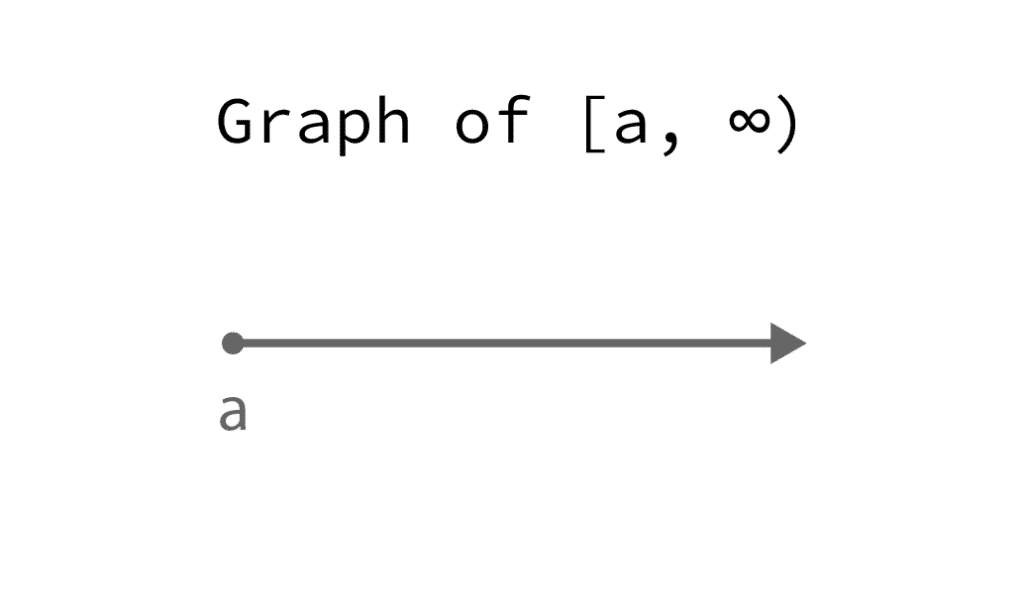
And ∞ indicates that the interval extends indefinitely to the right:
Create intervals in R
We will use the intervals package in R to create intervals.
The function Intervals() takes as input a matrix and creates a collection of intervals with common endpoints closure.
Here’s an example:
library("intervals")

# x is a collection of intervals
# that are all left-closed and right-open
x = Intervals(
  matrix(c(3, 9,
           -1, 4,
           2, Inf), nrow = 3, byrow = TRUE),
  closed = c(TRUE, FALSE), # intervals are of the form [a, b)
  type = "Z" # inputs are integers
)

# name the intervals
rownames(x) = c("a","b","c")

print(x)
Output:
Object of class Intervals
3 intervals over R:
a [3, 9)
b [-1, 4)
c [2, Inf)
If you want a collection of intervals with different endpoints closure, use the function: Intervals_full().
Alternatively you can transform an “Intervals” object to an “Intervals_full” object using the following code:
y = as( x, "Intervals_full" )

print(y)
Output:
Object of class Intervals_full
3 intervals over R:
a [3, 9)
b [-1, 4)
c [2, Inf)
Open all intervals in y
open_intervals(y)

print(y)
Output:
Object of class Intervals_full
3 intervals over Z:
(2, 9)
(-2, 4)
(1, Inf)
Now we need to close some endpoints in y.
y has 3 intervals, so it has 6 endpoints, numbered from 1 to 6 and counted vertically as follows:
1 4
2 5
3 6
# closing some endpoints in y
closed(y)[1] = TRUE
closed(y)[3] = TRUE
closed(y)[4] = TRUE

print(y)
Output:
Object of class Intervals_full
3 intervals over Z:
[3, 9]
[-1, 4)
[2, Inf)
Graph intervals in R
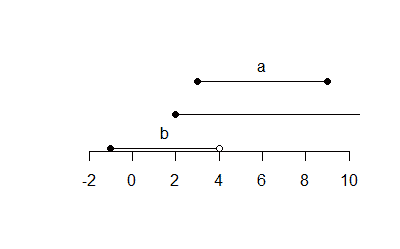
plot(x, xlim = c(-2, 10))
Output:
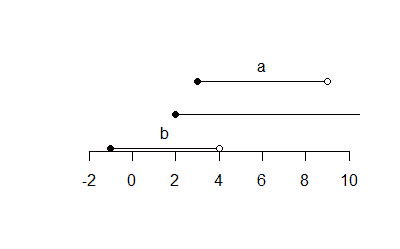
plot(y, xlim = c(-2, 10))
Output:
References
For more information, refer to the “intervals” package documentation on CRAN.