The Chi-square independence test is used to test whether 2 categorical variables, each having 2 or more categories, are dependent or independent of each other.
- The null hypothesis H0 states that the 2 variables are independent (i.e. knowing the value of one does not tell us anything about the other)
- The alternative hypothesis H1 states that the 2 variables are dependent (i.e. knowing the distribution of one helps us predict the other)
So after running the Chi-square independence test:
- If the p-value is < 0.05: then we reject the null, so the data provide convincing evidence that the 2 variables are associated.
- If the p-value is > 0.05: then we cannot reject the null hypothesis, so we cannot rule out the possibility that the 2 variables are independent.
Information that should be reported
Reporting the use of a Chi-square independence test
When reporting a Chi-square independence test, the following information should be mentioned in the METHODS section:
- the assumptions of the Chi-square test (the observations should be drawn independently from the population, and each cell must have at least 5 cases in 80% of the cells and no cell should have less than 1)
- the objective of the test
- the threshold for statistical significance (generally set at 0.05).
Example:
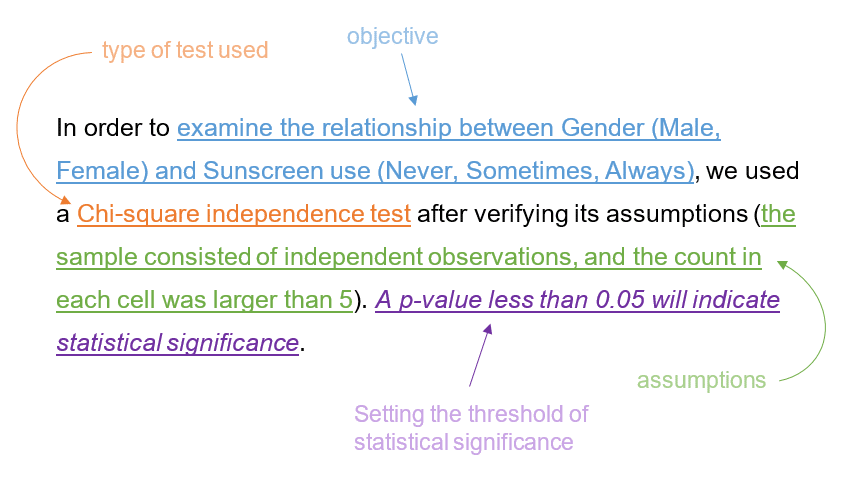
In order to examine the relationship between Gender (Male, Female) and Sunscreen use (Never, Sometimes, Always), we used a Chi-square independence test after verifying its assumptions (the sample consisted of independent observations, and the count in each cell was larger than 5). A p-value less than 0.05 will indicate statistical significance.
Reporting the output of a Chi-square independence test
And the following should be mentioned in the RESULTS section:
- the results of the Chi-square test:
- the value of the Chi-square statistic
- the degrees of freedom (equal to (the number of categories of the first variable – 1) * (the number of categories of the second variable -1))
- and the p-value
- the consequence/interpretation of these results
- Cramer’s V or any other strength test, if used.
Example:
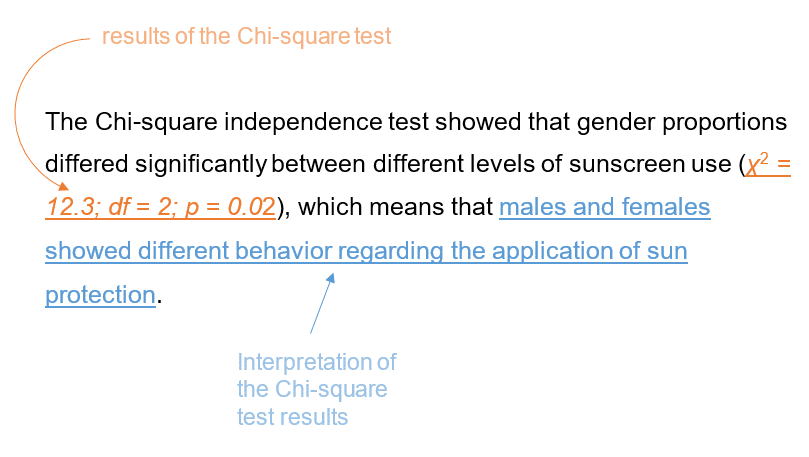
The Chi-square independence test showed that gender proportions differed significantly between different levels of sunscreen use (χ2 = 12.3; df = 2; p = 0.02), which means that males and females showed different behavior regarding the application of sun protection.
Further reading
- How to Report a Chi-Square Goodness-of-Fit Test
- How Old Should Your Article References Be? Based on 3,823,919 Examples
- How Many References Should a Research Paper Have? Study of 96,685 Articles
- Statistical Software Popularity in 40,582 Research Papers
- Checking the Popularity of 125 Statistical Tests and Models