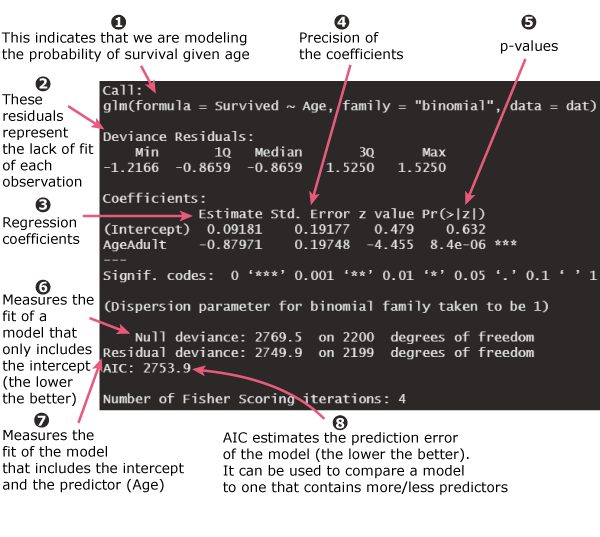
In this tutorial, we are going to run a logistic regression using the Titanic dataset available in R:
# load the Titanic dataset as a data.frame
dat = as.data.frame(Titanic)
dat = dat[rep(1:nrow(dat), dat$Freq), -5]

summary(dat)
#  Class         Sex          Age       Survived
# 1st :325   Male  :1731   Child: 109   No :1490
# 2nd :285   Female: 470   Adult:2092   Yes: 711
# 3rd :706
# Crew:885

# logistic regression to model
# the probability of survival given age
summary(glm(Survived ~ Age, data = dat, family = binomial))
1. Logistic regression equation

The formula \(Survived \sim Age\) corresponds to the logistic regression equation:
\(\log(\frac{P}{1 – P}) = \beta_0 + \beta_1 Age\)
Where \(P\) is the probability of having the outcome, i.e. the probability of surviving.
2. Deviance residuals
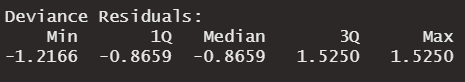
A deviance residual measures how much each observation contributes to the deviance (which is a measure of the model’s goodness of fit, see below). In other words, the deviance residuals reflect the model fit at each observation. But their distribution is not that important to us, so we can skip this part of the R output.
3, 4, 5. Logistic regression coefficients, standard errors, and p-values
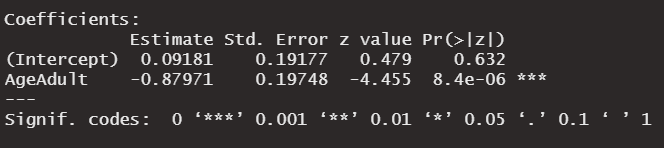
Since Age is a binary variable (child/adult) and its coefficient (β = -0.87971) is statistically significant (p < 0.05), then it can be interpreted as follows:
Adults had 0.42 (eβ = 0.42) times the survival odds of children.
Alternatively, we can say that:
Adults had 58% (1- 0.42 = 0.58) less odds of surviving than children.
The standard error is a measure of uncertainty of the logistic regression coefficient. It is useful for calculating the p-value and the confidence interval for the corresponding coefficient.
In our case, we have: Std. Error = 0.19748, so we can calculate the 95% confidence interval using the following formula:
95% Confidence Interval = exp(β ± 2 × Std. Error) = exp(-0.87971 ± 2 × 0.19748) = [ 0.28, 0.62 ]
So we can say that:
We are 95% confident that adults had on average 38 to 72% (1 - 0.62 = 0.38 and 1 - 0.28 = 0.72) less odds of surviving than Children.
For more information on how to interpret the logistic regression coefficients and intercept in different cases, see my other articles: Interpret Logistic Regression Coefficients and Interpret Logistic Regression Intercept.
6, 7. Null and residual deviance

Deviance measures the goodness of fit of a logistic regression model. A deviance of 0 means that the logistic regression model describes the data perfectly, and a higher value corresponds to a less accurate model.
- Null deviance measures the fit of a model that only includes the intercept. It is useful for comparison purposes.
- Residual deviance measures the fit of the model that includes the intercept and the predictor: Age.
In our case, the residual deviance is smaller than the null deviance (2749.9 vs 2769.5), which means that the presence of Age improves the model fit.
For more information, see: Deviance in the Context of Logistic Regression.
8. Akaike Information Criterion (AIC)
AIC estimates the prediction error of the logistic regression model: a lower AIC corresponds to more accurate model predictions.
In practice, AIC can be used to compare the current model to one that contains more/less predictors. For example, if adding another predictor X to the model does not cause a drop in the AIC, then we can conclude that X does not improve the model’s prediction of the outcome probability.