A variable is a confounder if it satisfies one of the following conditions:
- It has been proven so in previous studies.
- Adjusting for it produces more than 10% change in the relationship between the exposure and the outcome.
- It is associated with both the exposure and the outcome, without being on the causal pathway between the two.
- It represents a common cause of both the exposure and the outcome.
Below, we will evaluate these 4 methods of detecting confounding, and discuss their advantages and limitations.
1. A confounder may be mentioned in previous literature
How it works:
When coming up with a list of potential confounders, consider those mentioned in previous studies.
Advantage:
A literature review can be done before conducting the study. This is important because detecting potential confounders will guide your decision on which variables to collect.
Limitation:
A lot of studies control for many more variables than they need to. In fact, some of these variables may not be confounders and should not be controlled for (such as mediators and colliders). By following the steps of others, you may end up with a long list of variables to collect and a flawed model that overcontrols for everything.
Another limitation of this method is that it cannot be used in the absence of prior research on the subject.
2. A confounder changes the relationship between the exposure and the outcome
How it works:
This method is based on the following fact:
If the relationship between the exposure X and the outcome Y is confounded by C, then adjusting for C will alter the association between X and Y.
We can use this fact to test if a given variable C can be considered a potential confounder.
First, we measure the association between X and Y with and without adjusting for C, and then we compare these measures. This comparison can be done using:
- Regression analysis
- Stratified analysis
1. Using regression analysis
First, estimate the relationship between the exposure X and the outcome Y using a simple regression model:
Y = β0 + β1 X
Then, adjust for the variable C by including it in the model, and estimate that same relationship:
Y = β0 + β1 X + β2 C
There is a signal of confounding by C if the coefficient β1 (which represents the effect of X on Y) differs by more than 10% between the 2 models.
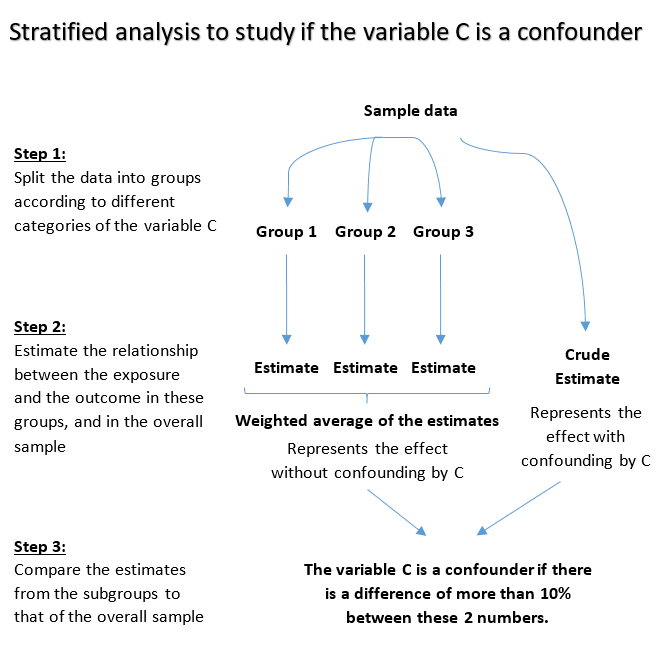
2. Using stratified analysis
Split the sample into multiple subgroups (also called strata) according to different categories of the potential confounder C.
Estimate the relationship between exposure and outcome in the different strata, and compare these results to the crude estimate i.e. without doing the stratification.
The variable C is a confounder if the crude estimate is considerably different compared to the stratum specific estimates.
Here’s an illustration that shows how stratified analysis works:
Advantage
This method provides an easy and quick way to flag variables as potential confounders, especially when working with large datasets where we do not have much information about confounding from previous studies.
Limitation:
This method can only be used after data have been collected. So detecting confounders outside of the set of collected variables is not possible.
A more serious limitation of this method is that it is not an optimal solution because:
If a variable is a confounder, then it will certainly cause a change in the relationship between the exposure and the outcome. However, not every variable that causes a change in the relationship between the exposure and the outcome is a confounder. A lot of factors, other than confounding, can cause this effect including mediators — these are variables that explain the causal effect of the exposure X on the outcome Y:
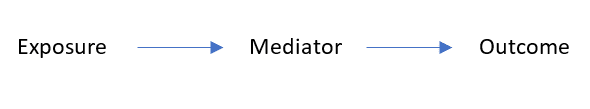
So a mediator is a variable that you don’t want to control for, since is it part of how the exposure affects the outcome.
Conclusion:
This method is not sufficient to declare a variable a confounder. But it can be used as a preliminary test to determine whether a variable C is worth requiring further investigation, or as a method to eliminate the possibility of confounding by C.
3. A confounder is associated with both the exposure and the outcome without being on the causal pathway between the two
How it works:
According to this method, a variable is a confounder if it satisfies the following 3 conditions:
- It should be associated with the exposure X.
- It should be associated with the outcome Y in the absence of the exposure.
- It should not be a consequence of the exposure (in other words, it should not be on the causal pathway between exposure and outcome).
So for a given variable C, we will have to answer 3 questions:
1. Is C associated with X?
This can be answered from the data, for example, by running the simple linear regression model:
X = β0 + β1 C
A statistically significant β1 coefficient reflects an association between C and X.
2. Is C associated with Y independently from X?
This can be answered from the data, for example, by running the following multiple linear regression model:
Y = β0 + β1 C + β2 X
A statistically significant β1 coefficient reflects an association between C and Y, independently from X.
3. Can C be caused by X?
This should be answered from your background knowledge about the causal relationship between the variables C and X.
Advantage:
Assumes minimal knowledge of the causal relationship between the exposure, the outcome, and the potential confounder, since we only need to answer the question: can C be caused by X?
Limitation:
We still need data to answer whether C is associated with both X and Y. So this type of analysis can only be used after conducting the study and not for designing one.
A more serious limitation of this method is that it is not optimal, since it sometimes flags the wrong variables as confounders.
Consider the following diagram:
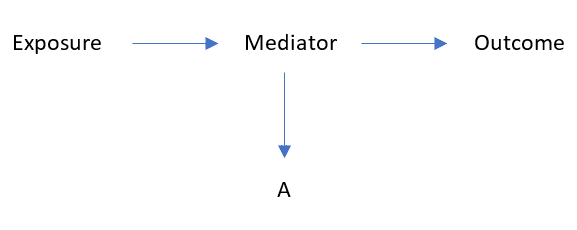
In this example, “A” is a variable caused by the mediator, but certainly not a confounder (since it does not bias the measured effect of the exposure on the outcome).
However, the variable A satisfies the above definition of confounding:
- It is statistically associated with the exposure: since the “exposure” affects the “mediator”, which in turn affects “A”.
- It is statistically associated with the outcome independently of the exposure: since the relationship between the variable A and the outcome is confounded by the mediator (note that the mediator is a common cause of both).
- It is not on the causal path between exposure and outcome.
Conclusion:
This method, which represents the classical definition of confounding, is not complete and precise enough to detect confounding. So our quest is not over yet.
4. A confounder is a common cause of both the exposure and the outcome
This method does not use data in order to determine whether there is confounding. Instead it requires background knowledge about the causal relationships between variables.
In particular it requires the ability to list all common causes of the exposure X and the outcome Y.
It is based on the following rule:
The presence of a common cause C of X and Y makes us expect an association between X and Y, although not a causal one. This association is, in fact, due to confounding by the common cause C.
Advantage:
This method presents a way to detect confounding without being based on data. So it can help us choose which variables to collect before conducting the study,
Limitation:
This method is impractical when the causal relationship between variables is unknown or very complex to understand.
If you are interested, I have a separate article where I walk you through an example of how to identify and adjust for confounding variables based on finding common causes.