I analyzed the methods sections of 43,110 randomly chosen research papers, uploaded to PubMed Central between the years 2016 and 2021, in order to check the popularity of 125 statistical methods in medical research.
I used the BioC API to download the articles (see the References section below).
Here’s a summary of the key findings
The most popular statistical tests in research articles are:
- Student’s t-test: Used to compare the mean of a population to a theoretical value, or compare means between 2 populations.
- Chi-square test: Used to compare 2 proportions.
- Mann-Whitney U test: Used to compare medians between 2 populations.
- One-way ANOVA and Kruskal-Wallis test: Used to compare means between more than 2 populations.
- Kaplan-Meier estimator: Used to estimate the survival function when analyzing time-to-event data.
- Log-rank test: Used to compare survival times between 2 groups.
The most popular statistical models in research articles are:
- Logistic regression: Used to study the relationship between 1 or more predictor variables and 1 binary outcome variable.
- Linear regression: Used to study the relationship between 1 or more predictor variables and 1 continuous outcome variable.
- Cox regression: Used to study the relationship between 1 or more predictor variables and the survival time of patients.
Top statistical methods overall
In order to visualize the popularity of all 125 statistical tests and models, I created a Fisher-shaped word cloud which is a cluster of words showing the most popular ones in bolder and larger fonts:
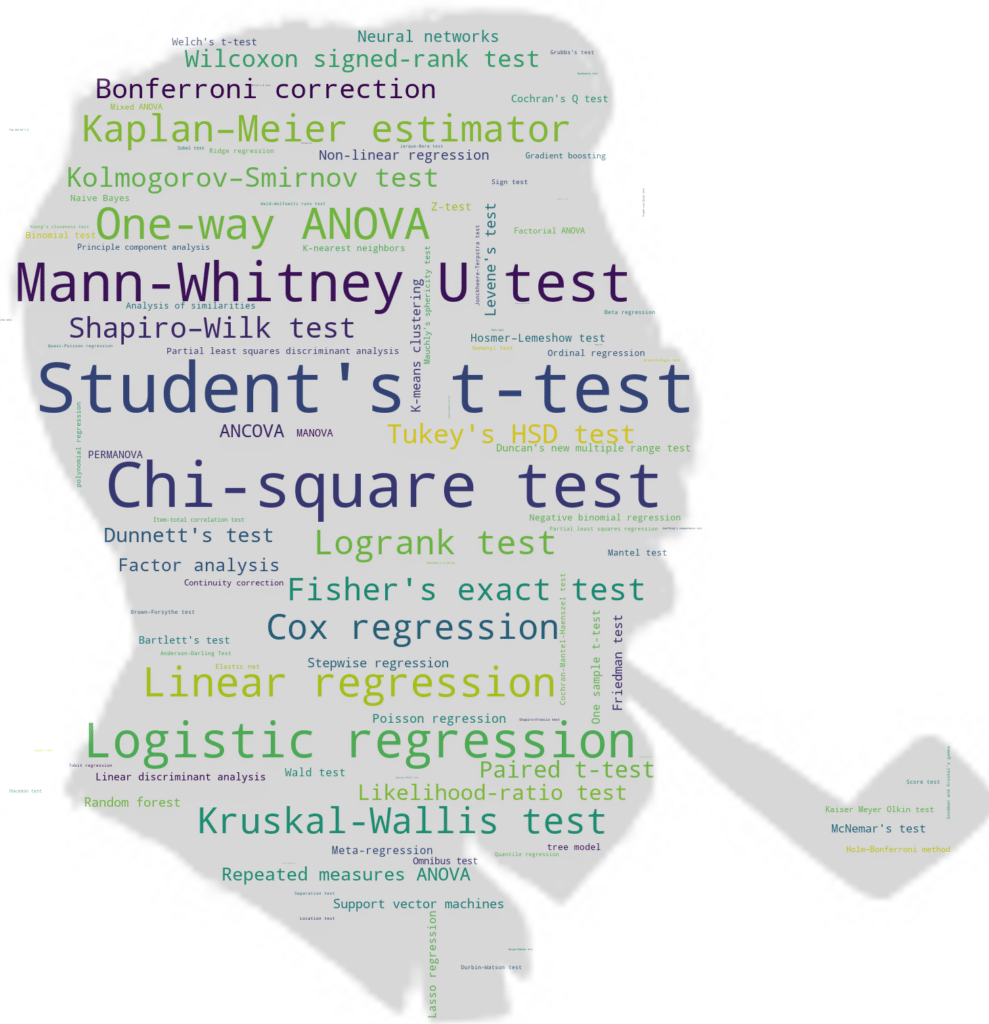
And here’s a table for those of you who prefer to look at numbers:
| Rank | Statistical Test/Model | Number of Mentions (In 43,110 Articles) | Mentions in Percent |
|---|---|---|---|
| 1 | Student’s t-test | 12831 | 29.76% |
| 2 | Chi-square test | 10437 | 24.21% |
| 3 | Mann-Whitney U test | 8063 | 18.70% |
| 4 | Logistic regression | 6482 | 15.04% |
| 5 | One-way ANOVA | 5020 | 11.64% |
| 6 | Linear regression | 4460 | 10.35% |
| 7 | Kaplan–Meier estimator | 3778 | 8.76% |
| 8 | Kruskal-Wallis test | 3479 | 8.07% |
| 9 | Cox regression | 3164 | 7.34% |
| 10 | Logrank test | 3066 | 7.11% |
| 11 | Fisher’s exact test | 2578 | 5.98% |
| 12 | Bayesian methods | 2370 | 5.50% |
| 13 | Shapiro–Wilk test | 2180 | 5.06% |
| 14 | Bonferroni correction | 1921 | 4.46% |
| 15 | Kolmogorov–Smirnov test | 1894 | 4.39% |
| 16 | Tukey’s HSD test | 1834 | 4.25% |
| 17 | Wilcoxon signed-rank test | 1454 | 3.37% |
| 18 | Paired t-test | 1388 | 3.22% |
| 19 | Likelihood-ratio test | 1245 | 2.89% |
| 20 | Dunnett’s test | 1074 | 2.49% |
| 21 | ANCOVA | 894 | 2.07% |
| 22 | Repeated measures ANOVA | 882 | 2.05% |
| 23 | Factor analysis | 803 | 1.86% |
| 24 | Neural networks | 629 | 1.46% |
| 25 | Levene’s test | 576 | 1.34% |
| 26 | Non-linear regression | 490 | 1.14% |
| 27 | Random forest | 454 | 1.05% |
| 28 | Friedman test | 450 | 1.04% |
| 29 | Support vector machines | 449 | 1.04% |
| 30 | Stepwise regression | 428 | 0.99% |
| 31 | K-means clustering | 424 | 0.98% |
| 32 | Poisson regression | 399 | 0.93% |
| 33 | McNemar’s test | 375 | 0.87% |
| 34 | Hosmer–Lemeshow test | 340 | 0.79% |
| 35 | Wald test | 334 | 0.77% |
| 36 | Z-test | 317 | 0.74% |
| 37 | Meta-regression | 315 | 0.73% |
| 38 | One sample t-test | 296 | 0.69% |
| 39 | Lasso regression | 289 | 0.67% |
| 40 | Duncan’s new multiple range test | 268 | 0.62% |
| 41 | Cochran’s Q test | 259 | 0.60% |
| 42 | PERMANOVA | 254 | 0.59% |
| 43 | Bartlett’s test | 252 | 0.58% |
| 44 | Welch’s t-test | 250 | 0.58% |
| 45 | Linear discriminant analysis | 250 | 0.58% |
| 46 | MANOVA | 236 | 0.55% |
| 47 | Omnibus test | 215 | 0.50% |
| 48 | K-nearest neighbors | 178 | 0.41% |
| 49 | Ordinal regression | 170 | 0.39% |
| 50 | Tree models | 162 | 0.38% |
| 51 | Mantel test | 162 | 0.38% |
| 52 | Naive Bayes | 159 | 0.37% |
| 53 | Binomial test | 156 | 0.36% |
| 54 | Partial least squares discriminant analysis | 151 | 0.35% |
| 55 | Analysis of similarities | 146 | 0.34% |
| 56 | Negative binomial regression | 140 | 0.32% |
| 57 | Mauchly’s sphericity test | 125 | 0.29% |
| 58 | Principle component analysis | 124 | 0.29% |
| 59 | Continuity correction | 121 | 0.28% |
| 60 | Holm–Bonferroni method | 119 | 0.28% |
| 61 | Factorial ANOVA | 111 | 0.26% |
| 62 | Mixed ANOVA | 105 | 0.24% |
| 63 | Kaiser Meyer Olkin test | 100 | 0.23% |
| 64 | Gradient boosting | 93 | 0.22% |
| 65 | Cochran-Mantel-Haenszel test | 84 | 0.19% |
| 66 | Polynomial regression | 70 | 0.16% |
| 67 | Elastic net | 66 | 0.15% |
| 68 | Ridge regression | 60 | 0.14% |
| 69 | Sign test | 60 | 0.14% |
| 70 | Item-total correlation test | 53 | 0.12% |
| 71 | Median test | 44 | 0.10% |
| 72 | Jonckheere–Terpstra test | 44 | 0.10% |
| 73 | Quantile regression | 40 | 0.09% |
| 74 | Partial least squares regression | 40 | 0.09% |
| 75 | Score test | 39 | 0.09% |
| 76 | Grubbs’s test | 35 | 0.08% |
| 77 | Brown–Forsythe test | 34 | 0.08% |
| 78 | Anderson-Darling test | 34 | 0.08% |
| 79 | Nemenyi test | 32 | 0.07% |
| 80 | Beta regression | 31 | 0.07% |
| 81 | Durbin–Watson test | 28 | 0.06% |
| 82 | Sobel test | 24 | 0.06% |
| 83 | Hausman test | 21 | 0.05% |
| 84 | Tobit regression | 14 | 0.03% |
| 85 | Separation test | 12 | 0.03% |
| 86 | Goodman and Kruskal’s gamma | 11 | 0.03% |
| 87 | Quasi-Poisson regression | 10 | 0.02% |
| 88 | Vuong’s closeness test | 10 | 0.02% |
| 89 | Wald–Wolfowitz runs test | 9 | 0.02% |
| 90 | Jarque-Bera test | 9 | 0.02% |
| 91 | Location test | 9 | 0.02% |
| 92 | Breusch–Pagan test | 7 | 0.02% |
| 93 | Shapiro–Francia test | 7 | 0.02% |
| 94 | Phillips–Perron test | 5 | 0.01% |
| 95 | Cramér–von Mises test | 5 | 0.01% |
| 96 | Fay and Wu’s H | 5 | 0.01% |
| 97 | Kuiper’s test | 5 | 0.01% |
| 98 | Randomness test | 4 | 0.01% |
| 99 | White test | 3 | 0.01% |
| 100 | Park test | 3 | 0.01% |
| 101 | Sargan–Hansen test | 3 | 0.01% |
| 102 | Chauvenet’s criterion | 3 | 0.01% |
| 103 | Hoeffding’s independence test | 3 | 0.01% |
| 104 | Dixon’s Q test | 2 | 0.00% |
| 105 | Ramsey RESET test | 2 | 0.00% |
| 106 | Sequential probability ratio test | 1 | 0.00% |
| 107 | Scheirer–Ray–Hare test | 1 | 0.00% |
| 108 | Durbin test | 1 | 0.00% |
| 109 | Cuzick–Edwards test | 1 | 0.00% |
| 110 | Cochran’s C test | 1 | 0.00% |
| 111 | Multinomial test | 1 | 0.00% |
| 112 | Van der Waerden test | 1 | 0.00% |
| 113 | Tukey’s test of additivity | 0 | 0.00% |
| 114 | Lepage test | 0 | 0.00% |
| 115 | Hartley’s test | 0 | 0.00% |
| 116 | Glejser test | 0 | 0.00% |
| 117 | GRIM test | 0 | 0.00% |
| 118 | Siegel–Tukey test | 0 | 0.00% |
| 119 | Tukey–Duckworth test | 0 | 0.00% |
| 120 | Information matrix test | 0 | 0.00% |
| 121 | Breusch–Godfrey test | 0 | 0.00% |
| 122 | Goldfeld–Quandt test | 0 | 0.00% |
| 123 | Squared ranks test | 0 | 0.00% |
| 124 | Principle components regression | 0 | 0.00% |
| 125 | ABX test | 0 | 0.00% |
Popularity of normality tests
Normality tests are used to determine if the data follow a normal distribution, an essential requirement for many statistical tests and models.
The most used normality test was the Shapiro-Wilk test (mentioned in 5.06% of research papers), followed by Kolmogorov-Smirnov test (4.39%), Anderson-Darling test (0.08%), Jarque-Bera test (0.02%), and Cramér–von Mises test (0.01%).
Popularity of machine learning algorithms
Machine learning algorithms are divided into 2 classes:
- Supervised learning algorithms
- Unsupervised learning algorithms
1- Supervised learning algorithms are models used to predict an outcome, given 1 or more predictors. The most popular algorithms in our data were:
- Neural networks (mentioned in 1.46% of research papers)
- Non-linear regression (1.14%)
- Random forest (1.05%)
- Support vector machines (1.04%)
- Lasso regression (0.67%)
- Classification and regression trees (0.38%)
- Naïve Bayes (0.37%)
- Gradient boosted models (0.22%)
- Ridge regression (0.14%).
Note that these models were far less popular than inferential models such as linear and logistic regression (10.35% and 15.04% respectively).
2- Unsupervised learning algorithms are methods used to discover patterns or group unlabeled data (i.e. in cases where we don’t have an outcome variable). The most popular methods in this category were:
- Factor analysis (mentioned in 1.86% of research papers)
- K-means clustering (0.98%)
- Principle component analysis (0.29%)
Popularity of Bayesian methods
Bayesian methods were mentioned only in 5.5% of research papers, and there is no sign of an increasing Bayesian trend between the years 2016 and 2021.
This however does not reflect the importance of Bayesian methods. In fact, some of the best books on statistics, such as Regression and Other Stories by Gelman, Hill and Vehtari, incorporate at least some form of Bayesian thinking when teaching frequentist statistics.
Challenges I faced while analyzing text data for this study
In this bonus section if you will, I thought it would be interesting to share some of the challenges I had to deal with while analyzing the methods sections of these 43,110 research papers looking for mentions of the statistical methods used.
All of the problems mentioned below were taken care of by using appropriate regular expressions — these are sequences of symbols and characters used to search for a particular pattern (corresponding to a statistical test/model) in the text.
1. Different spellings
For instance:
- Hosmer–Lemeshow, Hosmer Lemeshow, Hosmer and Lemeshow, Hosmer & Lemeshow, etc.
- K-nearest neighbors, K-nearest neighbours (British English spelling), KNN.
- Bonferroni correction, Bonferroni method, Bonferroni‘s method
- Chi square test, Chi-squared test, or χ2 test
2. Misspellings
Several incorrect spellings were surprisingly common, for instance:
| Incorrect Spelling | Number of occurrences | Correct Spelling |
| Cochrane Q test | 743 times | Cochran Q test |
| Kolmogorov-Smirnoff | 40 times | Kolmogorov-Smirnov |
| Kruskal-Willis | 7 times | Kruskal-Wallis |
3. Split words
For instance, when searching for the number of papers who reported the use of linear regression, it would be incomplete to search only for the phrase “linear regression” as sometimes the model may be reported as “linear and logistic regression were used”. Also, it would be wrong to search only for the word “linear” since “linear discriminant analysis” is a different statistical method than linear regression.
4. Alternative names
For instance, Student’s t-test is also known as: Independent t-test, Independent-samples t-test, and Two-sample t-test. This complicates the analysis as it requires knowledge of all synonyms for all statistical tests.
Although I did my best in finding these synonyms, if you notice anything missing or want to report an error, please email me by using the form in the contact page.
References
- Comeau DC, Wei CH, Islamaj Doğan R, and Lu Z. PMC text mining subset in BioC: about 3 million full text articles and growing, Bioinformatics, btz070, 2019.