I analyzed the content of 43,110 randomly chosen research papers from PubMed to learn more about R-squared.
Specifically, I wanted to answer the following questions:
- What is a good value for R-squared?
- What is a low value for R-squared?
- Is a higher R-squared always better?
- Is a low R-squared necessarily bad?
Let’s start with a brief summary of the results before we dive into the detailed analysis of the data.
Here’s a summary of the key findings
1. Only 33.4% of the studies that used linear regression reported the R-squared value.
2. The average value of R-squared in medical research is 0.499, which means that the average linear regression model explains 49.9% of the outcome variance.
3. There is no natural threshold against which we can judge if an R-squared value is too high or too low.
4. R-squared values near both extremes are quite common in medical research. In fact, 10% of regression models have an R-squared below 0.035, and 10% have an R-squared above 0.979.
5. A higher R-squared value is not necessarily better, since there is very weak correlation between the value of R-squared and the quality of the journal in which the result was published.
6. A low R-squared value is not an indicator of low-quality research, since getting a low R-squared value is not a statistically significant predictor of low journal impact factor.
33.4% of studies that used linear regression reported the R-squared value
Out of 43,110 analyzed research papers, 4460 reported the use of a linear regression model. Out of these, only 1490 (or 33.4%) reported the R-squared value.
This may be because R-squared is especially useful if we want to know how accurately the model predicts the outcome. However, in medical research, we would be mostly concerned with explaining the relationship between the predictors and the outcome more often than predicting that outcome. Therefore, knowing the value of R-squared is rarely interesting in medical research.
Range of R-squared values in research articles
In our sample, there were 3836 different R-squared values reported in 1490 research articles.
Let’s take a look at their distribution:
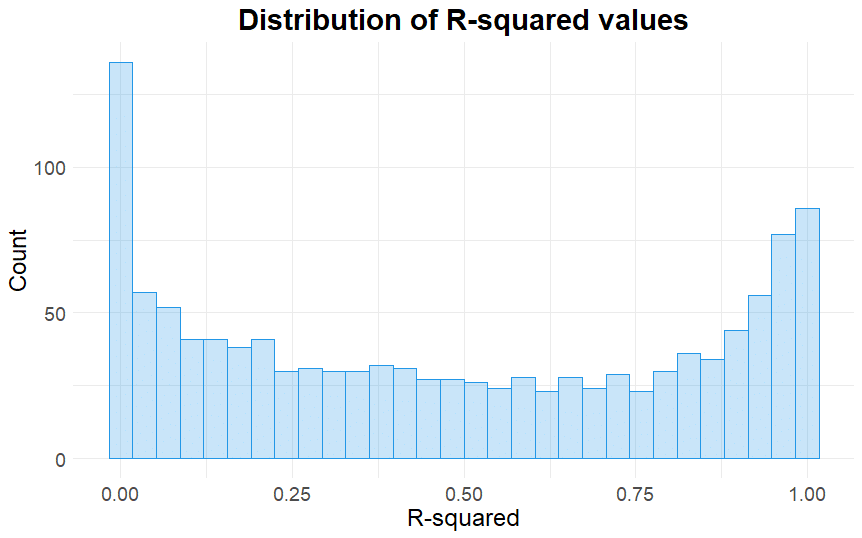
Two very important things to notice in this histogram:
- The R-squared values are distributed somewhat uniformly between the values 0.1 and 0.9.
- The distribution is bimodal: it has one peak near 0 and another peak near 1.
In retrospect, this is not what I expected to see! (I really thought the distribution would peak between the values 0 and 0.2 with a long right tail).
Here’s a quote from a statistics textbook that illustrates this point:
In typical applications in biology, psychology, marketing, and other domains, we would expect only a very small proportion of the variance in the response to be explained by the predictor, and an R2 value well below 0.1 might be more realistic!
An Introduction to Statistical Learning by Gareth James et al.
The following is a table that summarizes the distribution of observed R-squared values:
| Minimum | 25th Percentile | Median | Mean | 75th Percentile | Maximum |
|---|---|---|---|---|---|
| 0.0001 | 0.1660 | 0.4700 | 0.4993 | 0.8600 | 0.9999 |
Looking at these numbers we can conclude that:
- There is no natural threshold against which we can judge if an R-squared value is too high or too low.
- R-squared values near both extremes are common in medical research. In fact, 10% of R-squared values were below 0.035, and 10% were above 0.979.
R-squared does not reflect the importance of the results
Now we will turn to the following question:
Is there any difference in quality and importance of the research papers that reported a high versus low value of R-squared?
In order to answer this question, we will first need to define how we are going to measure the importance of a research article or the importance of a result.
The Journal Impact Factor (JIF) is a good and simple proxy for article importance that is good enough for our purposes — the higher the JIF, the more important the article.
So our objective is then reduced to analyzing the relationship between the R-squared value reported in a research article and the impact factor of the journal (JIF) where that article was published.
Here are the results of this analysis:
- A very weak positive correlation exists between the value of R-squared and the journal impact factor (r = 0.09). This means that a high value of R-squared is not correlated with a more important finding.
- If we define “low R-squared value” as lower than 0.035 for example, we find that there is no statistically significant relationship between a low R-squared and a low journal impact factor. This means that a low R-squared does not reflect a low-quality finding.
References
- Comeau DC, Wei CH, Islamaj Doğan R, and Lu Z. PMC text mining subset in BioC: about 3 million full text articles and growing, Bioinformatics, btz070, 2019.