For a linear regression model:
Y = β0 + β1X + β2Z + β3XZ + ε
If the coefficient of the interaction term β3 is statistically significant, then there is evidence of an interaction between X and Z. This means that the effect of X on the outcome Y is different for different sub-categories of Z, and vice-versa.
Information that should be reported:
- Why you included the interaction term in your regression model
- The regression output table: including the coefficients, standard errors, and p-values of the main effects and the interaction term
- The interpretation of the cause of the interaction
1. Reporting the reason for including the interaction term
The METHODS section of the research paper is where you justify testing for an interaction between 2 variables.
There are many reasons for adding an interaction term between 2 predictors in a regression model including:
- When they have large main effects.
- When the effect of one changes for various subgroups of the other.
- When the interaction has been proven in previous studies.
- When you want to explore new hypotheses.
(For a detailed discussion of these reasons, refer to: Why and When to Include Interactions)
Here are 2 examples of how to report such information:
Example 1: “Since X and Z have large main effects on the outcome Y, we anticipate a possible interaction between the two. In order to evaluate such interaction, we will compare the fit (increase in R-squared and decrease in residual standard error) of a linear regression model with the interaction to one without the interaction”.
Example 2: “Based on a previous study that showed a statistically significant interaction between X and Z, we included an interaction term to model possible variation in the effect of X for different values of Z”.
2. Reporting the model output
The following should be included in the RESULTS section of the research paper:
- The regression table: including the coefficients, standard errors, and p-values of the main effects and the interaction term.
- The interpretation of the coefficient of the interaction term.
- A comparison between a model with the interaction and a model without the interaction: For instance, comparing the models’ R-squared, AIC, or residual standard deviations.
For example:
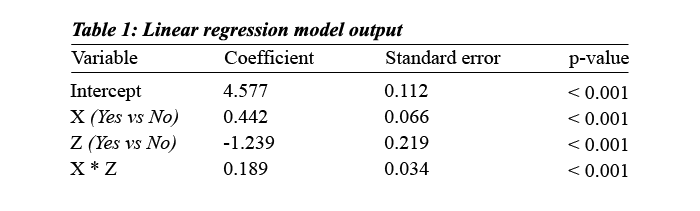
“Our model suggests that the presence of X and Z together has a larger effect on Y than the sum of each. Specifically, the presence of Z increases the effectiveness of X on Y by 0.189 (p < 0.001). This interaction explains 4.2% of the variation in the outcome Y (corresponding to an increase in R-squared of the model without interaction from 76.6% to 80.8% for the model with interaction).”
3. Interpreting the cause of the interaction
In the DISCUSSION section of the research paper, you should explore alternative explanations of your results.
Getting a statistically significant interaction is not enough to conclude that the interaction is real. In fact, you should present enough evidence to eliminate alternative explanations such as:
- Bias: By eliminating the possibility of differential bias across strata.
- Confounding: By adjusting for confounding in the regression model used to assess the interaction.
- Multiple testing: By lowering the threshold of statistical significance when exploring multiple interactions.
References
- Szklo M, Nieto FJ. Epidemiology: Beyond the Basics. 4th edition. Jones & Bartlett Learning; 2018.
- Celentano D, Szklo M. Gordis Epidemiology. 6th edition. Elsevier; 2018.