In this article we discuss:
- How to report the use of a random forest model
- How to report the results of a random forest model
1. How to report the use of a random forest model
The following information should be mentioned in the METHODS section of your research paper:
- The reason why you chose to use random forest.
- The dependent variable (i.e. the outcome Y that you are trying to predict).
- The independent variables (i.e. the predictors X1, X2, X3, etc.).
- How you set the number of predictors randomly sampled at each split a.k.a. mtry. (the default in R is the square root of the total number of predictors for classification problems, and the number of predictors divided by 3 for regression problems).
- How you set the number of trees built a.k.a. ntrees (the default in R is 500 trees).
- Tree model stopping criteria (the minimum number of observations in each terminal node).
- How the model performance will be evaluated (i.e. using cross-validation, a separate test set, or estimated using the Out-of-Bag error).
- [Optional] A brief description of how the random forest algorithm works (especially useful if you are addressing a non-technical audience, or people not familiar with machine learning).
- Reporting the specific values of mtry and ntree is not as important as describing how you proceeded to get to these values.
- Fine tuning these parameters have little effect on the random forest model accuracy in practice. In most cases, the default values will work just fine. [Source: Kuhn and Johnson – Applied Predictive Modeling]
Example:
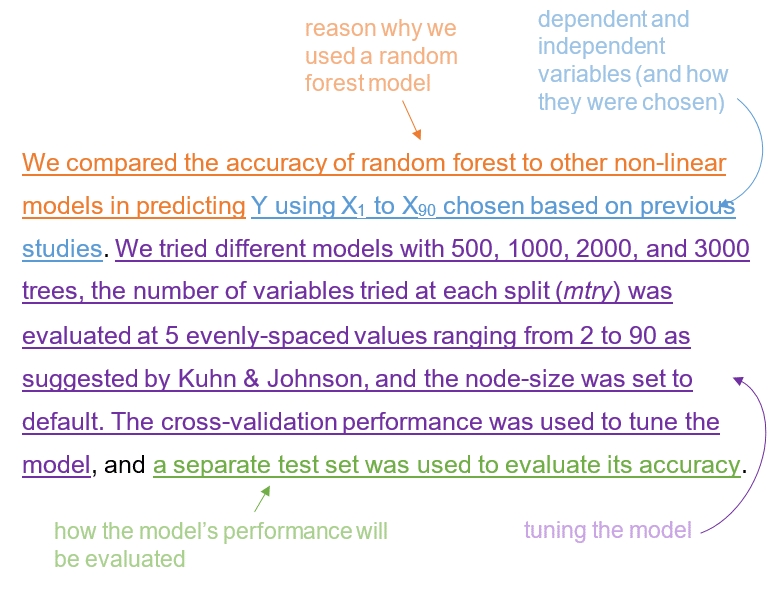
We compared the accuracy of random forest to other non-linear models in predicting Y using X1 to X90 chosen based on previous studies. We tried different models with 500, 1000, 2000, and 3000 trees, the number of variables tried at each split (mtry) was evaluated at 5 evenly-spaced values ranging from 2 to 90 as suggested by Kuhn & Johnson, and the node-size was set to default. The cross-validation performance was used to tune the model, and a separate test set was used to evaluate its accuracy.

A brief description of how the random forest algorithm works:
Random forest is a non-linear model that consists of aggregating the results of an ensemble of decision trees, each created using a subsample of the data. A decision tree works in a 2-step process:
1. It divides the predictor space into separate rectangular regions (these regions are split in a way so that they minimize the RSS for regression trees, and the GINI index or entropy for classification trees).
2. It calculates the mean (or mode) of the outcome values for the portion of the sample in each region which is then used to predict new data.
2. How to report the results of a random forest model
The following information should be mentioned in the RESULTS section of your research paper:
- Report performance metrics (accuracy, area under the curve, sensitivity/specificity, or precision/recall) and compare them to a base/null model to provide readers with a reference point against which they can judge your results.
- Report variable importance (i.e. a comparison between predictors in how much each of them contributed to a reduction in the Residual Sum of Squares or the GINI index), and try to provide an explanation for the most important ones.
Example:
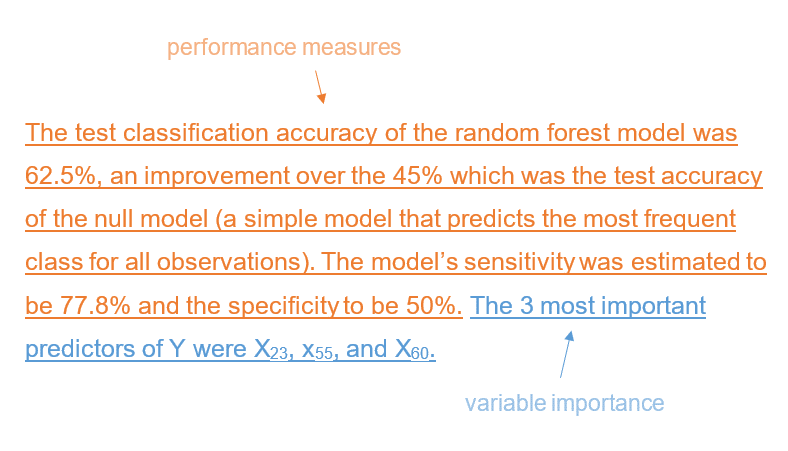
The test classification accuracy of the random forest model was 62.5%, an improvement over the 45% which was the test accuracy of the null model (a simple model that predicts the most frequent class for all observations). The model’s sensitivity was estimated to be 77.8% and the specificity to be 50%. The 3 most important predictors of Y were X23, x55, and X60.
