In this article we will discuss:
- How to report the use of stepwise regression
- How to report the output of stepwise regression
1. Reporting the use of stepwise regression
The following information should be mentioned in the METHODS section of the research paper:
- the outcome variable (i.e. the dependent variable Y)
- the predictor variables (i.e. the independent variables X1, X2, X3, etc.)
- the model used: e.g. linear, logistic, or cox regression
- the selection method used: e.g. Forward or backward stepwise selection
- how the model chose which variable to include/exclude at each step: e.g. according to p-values, R2 or RSS (Residual Sum of Squares)
- what was the stopping rule that limited the size of the final model: e.g. a specific p-value threshold, the AIC, or the BIC.
(For an easy explanation of the stopping rule and a step-by-step description of how stepwise selection works, I recommend my other article: Understand Forward and Backward Stepwise Regression)
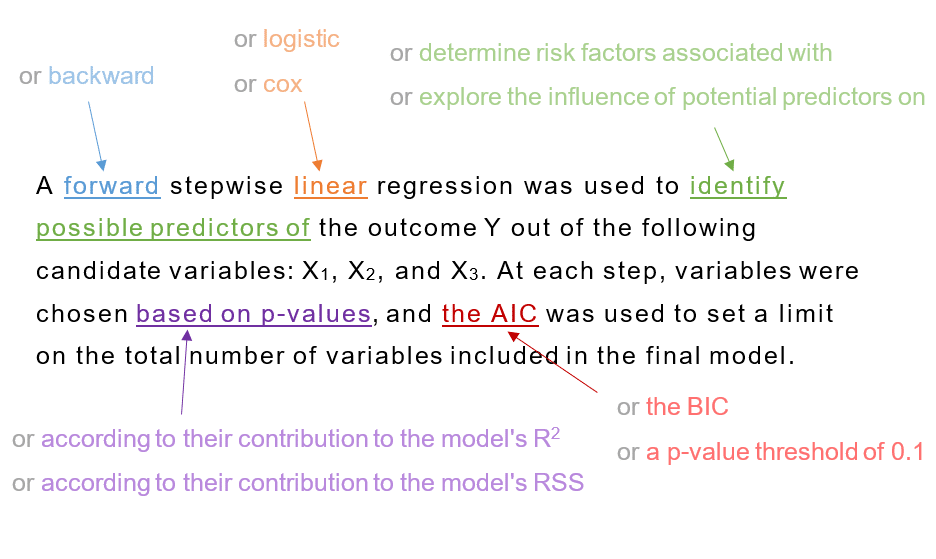
Here’s an example of reporting a stepwise regression model:
A forward stepwise linear regression was used to identify possible predictors of the outcome Y out of the following candidate variables: X1, X2, X3. At each step, variables were added based on p-values, and the AIC was used to set a limit on the total number of variables included in the final model.
- does not guarantee the elimination of unimportant variables
- does not guarantee the selection of the best predictors of the outcome Y
- should not be used to remove non-significant interactions for example (or in any other way that involves multiple testing without correction)
Note for SPSS users:
What is the stopping rule in SPSS? and how does the software choose which variable to include/exclude at each step?
- Forward regression in SPSS uses as a default entry criterion a p-value < 0.05 (that can be changed from the settings). At each step, the variable that has the highest correlation with the outcome Y will be entered in the model, if and only if it satisfies the default criterion (i.e. has a p-value < 0.05). The procedure stops when there are no variables left that satisfy the entry criterion (i.e. when all remaining variables have a p-value > 0.05 if included in the model).
- Backward regression in SPSS uses as a default elimination criterion a p-value > 0.1 (that can be changed from the settings). At each step, the variable that has the lowest correlation with the outcome Y will be removed from the model, if and only if it satisfies the elimination criterion (i.e., has a p-value > 0.1). The procedure stops when there are no variables left in the model that satisfy the elimination criterion (i.e. all variables in the model have a p-value < 0.1).
[Source: these 2 pages of IBM’s website: selection methods, and criteria for variable selection]
2. Reporting the output of stepwise regression
First of all, I should mention that the output of a stepwise regression cannot be interpreted in the same way as an ordinary linear or logistic regression. This is because the regression coefficients, p-values, and the R2 of the model will be biased, and therefore does not make any sense to report them. So stepwise regression is a good exploratory approach that should not be used for inferential purposes. (for more information, refer to the article mentioned above: Understand Forward and Backward Stepwise Regression)
Although SPSS reports the p-values of the stepwise model, you should know that these are invalid [Source], and that other statistical packages such as R and Python, do not report p-values of a stepwise model at all.
So what should you report in the RESULTS section of your research paper?
- the model’s input (i.e. the dependent and independent variables)
- the model’s output (i.e. the variables remaining in the final model)
- do NOT assume that the final model is the best one, nor that it contains the best predictors of Y
- do NOT report biased metrics such as: effect sizes, p-values, and the model’s R2
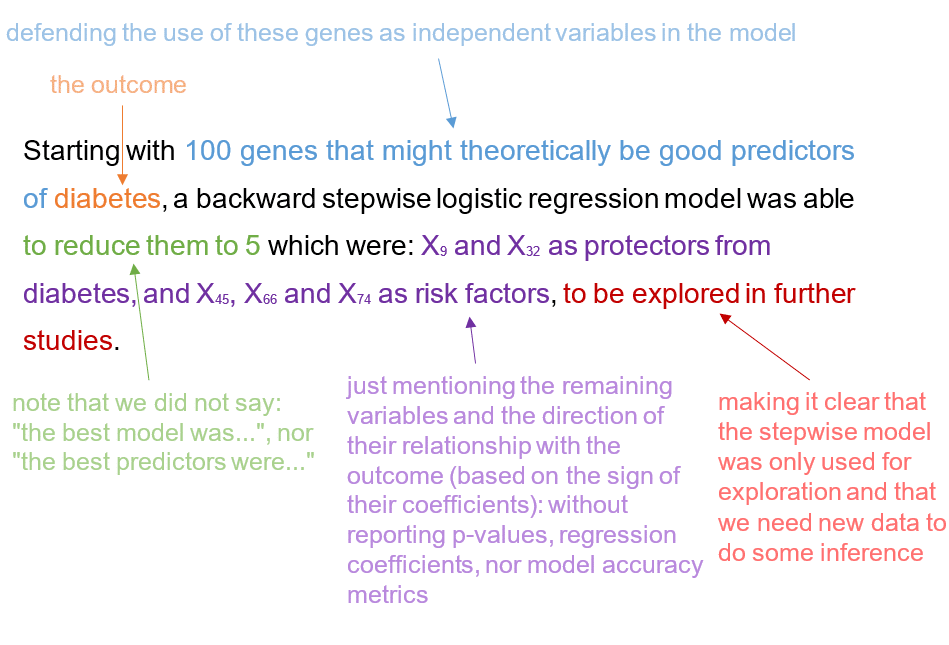
Here’s an example:
Starting with 100 genes that might theoretically be good predictors of diabetes, a forward stepwise logistic regression model was used to reduce them to 5 which were: X9 and X32 as protectors from diabetes, and X45, X66 and X74 as risk factors, to be explored in further studies.
Note that if you did the advanced stability and sensitivity analyses for the stepwise selection, these should be mentioned in the methods section and, of course, their results should be reported in the results section.