A polynomial p(x) is an expression of the form:
\(p(x) = a_0 + a_1x + a_2x^2 + a_3x^3 + … + a_nx^n\)
Where n is any non-negative integer.
Solve a polynomial p(x) in R
To solve the equation \(p(x) = 0\) in R, we can use the function: polyroot.
For example, let’s solve the equation:
\(p(x) = -\sqrt{2} – x + x^2 + 0.4x^3 = 0\)
# we use the coefficients of p(x) as inputs to polyroot
solutions = polyroot(c(-sqrt(2), -1, 1, 0.4))

print(solutions)
# outputs: 1.3390011-0i -0.8977101+0i -2.9412910-0i
Check if the solutions are real numbers
So, we can see that the solutions of p(x) are all real numbers (associated with 0i), but we can check for this in R:
# extracting the imaginary parts of the solutions
Im(solutions)

# outputs: -3.333339e-18  6.981698e-18 -3.648359e-18

# Which are numbers very close to 0,
# To get them to be exactly 0, we need to round our answer:
round(Im(solutions), 5)

# outputs: 0 0 0

# Finally, the following code outputs:
# TRUE if the solutions are real
# FALSE otherwise
all(round(Im(solutions), 5) == 0)

# outputs: TRUE

# With the help of this code,
# we can remove the imaginary parts of the solutions
# if they are real numbers
if(all(round(Im(solutions), 5) == 0)) {
  solutions = Re(solutions) # Re outputs the real part of a complex number
}

print(solutions)
# outputs: 1.3390011 -0.8977101 -2.9412910
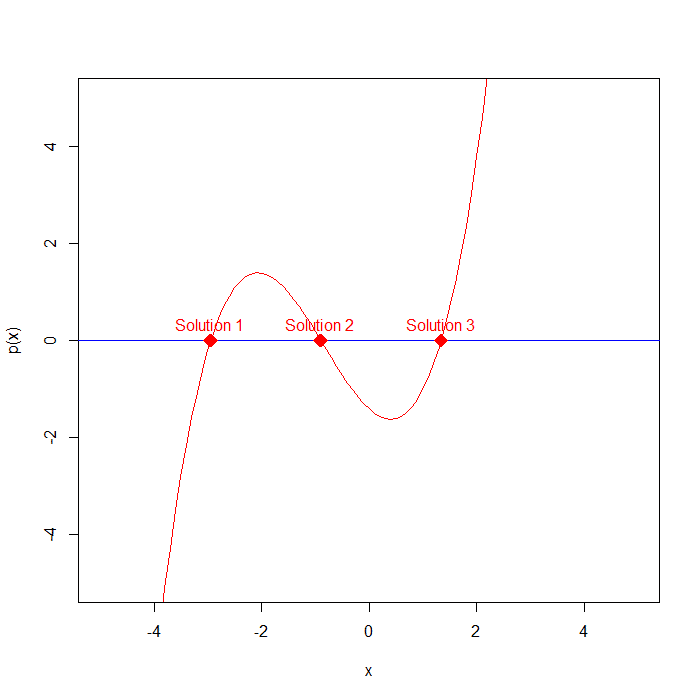
Plot p(x) and its solutions
# Coding the polynomial p(x) in R
p = function(x) {
  -sqrt(2) -x + x^2 + 0.4*x^3
}

# choosing the domain of p(x)
x = seq(-5, 5, by = 0.1) # so x is: -5, -4.9, -4.8, ..., 4.8, 4.9, 5

# plotting p(x) and limiting its range to -5, 5
plot(x, p(x), type = 'l', col = 'red', ylim = c(-5, 5))

# adding the x-axis
abline(h = 0, col = 'blue')

# adding the solutions
points(x = solutions, y = rep(0, length(solutions)), # x and y coordinates of the solutions
       pch = 18, cex = 2, col = 'red') # pch controls the shape of the points

# annotations
solutions = sort(solutions) # to annotate them from small to large
text(x = solutions, y = rep(0, length(solutions)),
     labels = paste('Solution', seq(1, length(solutions))),
     pos = 3, col = 'red')
Output: