Here’s a table that summarizes the similarities and differences between standardized and unstandardized linear regression coefficients:
| Unstandardized β | Standardized β | |
|---|---|---|
| Definition | Unstandardized coefficients are obtained after running a regression model on variables measured in their original scales | Standardized coefficients are obtained after running a regression model on standardized variables (i.e. rescaled variables that have a mean of 0 and a standard deviation of 1) |
| Interpretation | [Intuitive] A change of 1 unit in the independent variable X is associated with a change of β units in the outcome Y | [Nonintuitive] A change of 1 standard deviation in X is associated with a change of β standard deviations in Y |
| Used for | Interpreting the individual effect of X on Y | Comparing the effects of different predictors Xi on the outcome Y |
| Misleading when | We want to compare the importance of a variable Xi with other variables in the model (since these variables are on different scales) | Variables in the model have different standard deviations or follow different distributions |
| For binary variables | The coefficient has an intuitive interpretation | The coefficient is not interpretable |
Unstandardized regression coefficients
What are unstandardized regression coefficients?
Unstandardized coefficients are those produced by the linear regression model using the independent variables measured in their original scales.
For example the variable age measured in years, LDL cholesterol measured in mg/dl can be used as input in a linear regression to predict systolic blood pressure (SBP):
SBP(mmHg) = β0 + β1 × Age(years) + β2 × LDL(mg/dl) + ε
How to interpret the unstandardized regression coefficients?
Unstandardized coefficients are used to interpret the effect of each independent variable on the outcome. Their interpretation is straightforward and intuitive:
All other variables held constant, an increase of 1 unit in Xi is associated with an average change of βi units in Y.
In the example above, if β1 = 0.4 and β2 = 0.2 (and both coefficients were statistically significant), then we can say that:
- Getting 1 year older is associated with an average increase of 0.4 in SBP, assuming a stable LDL cholesterol level
- Similarly, for a given age, an increase of 1 mg/dl in the LDL level is associated with an average increase of 0.2 mmHg in SBP
Limitations of the unstandardized regression coefficients
Unstandardized coefficients are great for interpreting the relationship between an independent variable X and an outcome Y.
However, they are not useful for comparing the effect of an independent variable with another one in the model.
For example, which variable has a larger impact on SBP, LDL cholesterol or age?
We can try to answer this question by looking at the equation:
SBP(mmHg) = β0 + β1 × Age(years) + β2 × LDL(mg/dl) + ε
And with β1 = 0.4 and β2 = 0.2, we can conclude that:
“An increase of 20 mg/dl in LDL level has the same effect on the systolic blood pressure as aging 10 years”.
Still, this does not answer the question of which variable affects more the systolic blood pressure.
Specifically, the statement that “the effect of 10 years of age = the effect of 20 mg/dl LDL” is meaningless without specifying how hard it is to increase LDL by 20 mg/dl, specifically for someone who’s not familiar with this scale.
Conclusion:
A direct comparison of the coefficients for LDL and age is not meaningful as these variables are on different scales (LDL in mg/dl and age in years).
It turns out that the effects of these variables can be compared by using the standardized version of their coefficients. And that’s what we’re going to discuss next.
Standardized regression coefficients
What are standardized regression coefficients?
Standardized coefficients are obtained by running a linear regression model on the standardized form of the variables.
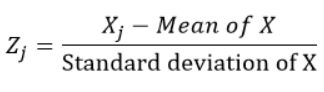
The standardized variables are calculated by subtracting the mean and dividing by the standard deviation for each observation, i.e. calculating the Z-score.
For each observation “j” of the variable X, we calculate the z-score using the formula:
In R, you can run the following command to standardize all the variables in the data frame:
# Raw_data is your data frame which contains the variables X1, X2 and Y
standardized_data = data.frame(scale(raw_data))

# Running linear regression on standardized_data will output standardized coefficients
model = lm(Y ~ X1 + X2, data = standardized_data)
summary(model)
Should you standardize the dependent variable?
Yes, the dependent variable should be standardized before running the regression model (as this is the widely accepted practice when calculating the standardized coefficients).
Here’s an example in SPSS:
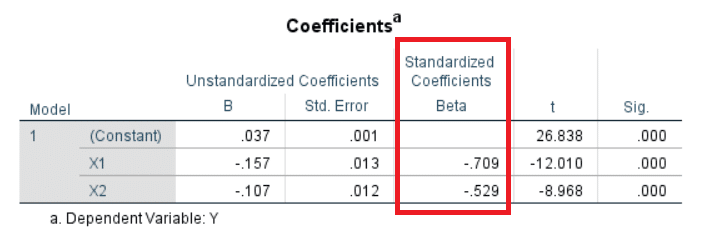
These standardized coefficients were calculated after SPSS automatically standardized X1, X2 and Y.
How to interpret the standardized regression coefficients?
The interpretation of standardized regression coefficients is nonintuitive compared to their unstandardized versions:
A change of 1 standard deviation in X is associated with a change of β standard deviations of Y.
And note that if X is a categorical variable, then its standardized coefficient cannot be interpreted as it doesn’t make sense to change X by 1 standard deviation.
In general, this is not a problem since these coefficients are not meant to be interpreted individually, but to be compared to one another in order to get a sense of the importance of each variable in the linear regression model.
For example:
Y = β0 + β1 X1 + β2 X2 + ε
If the standardized coefficients β1 = 0.5 and β2 = 1, we can conclude that:
X2 is twice as important as X1 in predicting Y, assuming that both X1 and X2 follow roughly the same distribution and their standard deviations are not that different (see the limitations section below).
Limitations of the standardized regression coefficients
The standardized coefficients are misleading if variables in the model have different standard deviations or follow different distributions.
Take a look at the following linear regression equation:
SBP(mmHg) = β0 + β1 × HDL(mg/dl) + β2 × LDL(mg/dl) + ε
It is reasonable to assume that HDL has higher variability than LDL cholesterol, and therefore different standard deviation. So in this case, standardizing these variable will cause them to be on different scales.
For more information on the limitation of standardized coefficients and what you can use instead, I recommend my other article: How to assess variable importance in linear and logistic regression.
Further reading
- Forward and Backward Stepwise Regression
- Variables to Include in a Regression Model
- 7 Tricks to Gets Statistically Significant p-Values
- Residual Standard Deviation/Error: Guide for Beginners
- Understand the F-statistic in Linear Regression
- P-value: A Simple Explanation for Non-Statisticians
- Relationship Between r and R-squared in Linear Regression