I analyzed a random sample of 76,147 full-text research papers, uploaded to PubMed Central between the years 2016 and 2021, in order to check the popularity of statistical software among medical researchers. (I used the BioC API to download the articles — see the References section below).
Out of these 76,147 research papers, only 40,582 (53.3%) mentioned the use of at least 1 statistical software.
Here’s a summary of the key findings
1- SPSS was the most used statistical software overall, mentioned in 40.48% of research papers, followed by R (20.52%) and Prism (17.38%).
2- The 6-year trend showed that SPSS had the largest decline (-1.43%) followed by SAS (-0.48%). However, R and Prism had the largest upward trends (+1.29% and +0.82% respectively).
3- The data also suggest that SPSS is more popular among beginners. This is in contrast with R and Prism, which were mentioned more commonly in papers published in high impact journals.
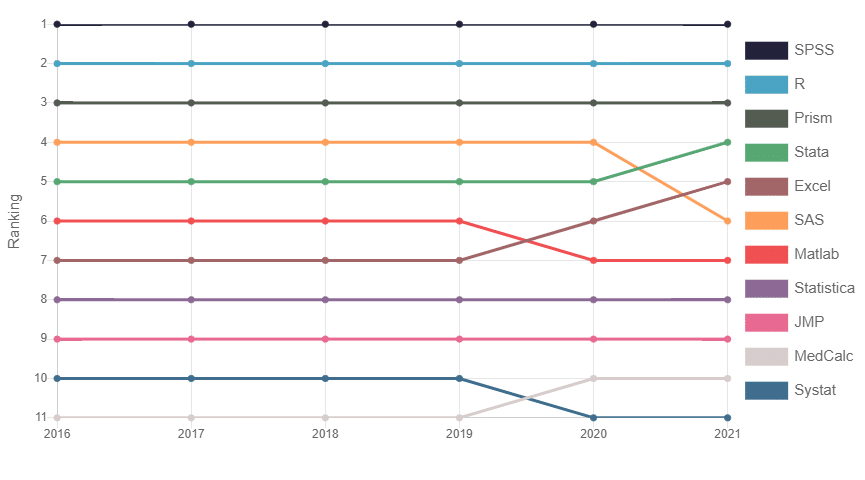
Top statistical packages over the years
The graph below shows that SPSS is still ranking number 1 for the past 6 years, R is in second position and Prism is third. Perhaps the most noticeable trend is the decline of SAS in 2021 which is being replaced by Stata and Microsoft Excel.
Most popular statistical packages overall
The table below can be read in the following way:
For instance, SPSS was reported to be used in 16,616 out of 40,582 research papers (= 40.48%), and showed a decreasing trend of 1.43% over the past 6 years.
| Overall Ranking | Software | Number of Mentions (Total: 40,582 articles) | Mentions (in Percent) | 6-Year Trend |
|---|---|---|---|---|
| 1 | SPSS | 16,616 | 40.48% | -1.43% |
| 2 | R | 8,423 | 20.52% | +1.29% |
| 3 | Prism | 7,132 | 17.38% | +0.82% |
| 4 | SAS | 3,693 | 9.00% | -0.48% |
| 5 | Stata | 3,386 | 8.25% | -0.15% |
| 6 | Matlab | 3,005 | 7.32% | -0.26% |
| 7 | Excel | 2,719 | 6.62% | +0.32% |
| 8 | Statistica | 763 | 1.86% | -0.03% |
| 9 | JMP | 633 | 1.54% | -0.04% |
| 10 | Systat | 457 | 1.11% | -0.09% |
| 11 | MedCalc | 385 | 0.94% | +0.01% |
| 12 | Minitab | 199 | 0.48% | 0.00% |
| 13 | OriginPro | 152 | 0.37% | +0.03% |
| 14 | Epi Info | 134 | 0.33% | +0.02% |
| 15 | PASS | 105 | 0.26% | +0.01% |
| 16 | SigmaStat | 105 | 0.26% | -0.03% |
| 17 | Mathematica | 89 | 0.22% | – |
| 18 | BV4.1 | 85 | 0.21% | – |
| 19 | Statgraphics | 72 | 0.18% | – |
| 20 | GenStat | 70 | 0.17% | – |
| 21 | NCSS | 69 | 0.17% | – |
| 22 | Weka | 66 | 0.16% | – |
| 23 | LIBSVM | 55 | 0.13% | – |
| 24 | JASP | 47 | 0.11% | – |
| 25 | JAGS | 37 | 0.09% | – |
| 26 | WinBUGS | 37 | 0.09% | – |
| 27 | OpenEpi | 36 | 0.09% | – |
| 28 | Pandas | 33 | 0.08% | – |
| 29 | Stan | 31 | 0.08% | – |
| 30 | S-Plus | 29 | 0.07% | – |
| 31 | MLwiN | 29 | 0.07% | – |
| 32 | ASReml | 26 | 0.06% | – |
| 33 | OpenBUGS | 22 | 0.05% | – |
| 34 | StatsDirect | 20 | 0.05% | – |
| 35 | Maple | 20 | 0.05% | – |
| 36 | LISREL | 19 | 0.05% | – |
| 37 | StatXact | 17 | 0.04% | – |
| 38 | The Unscrambler | 16 | 0.04% | – |
| 39 | SmartPLS | 16 | 0.04% | – |
| 40 | GeoDA | 15 | 0.04% | – |
| 41 | Chronux | 15 | 0.04% | – |
| 42 | GNU Octave | 14 | 0.03% | – |
| 43 | CSPro | 12 | 0.03% | – |
| 44 | Qlucore | 10 | 0.02% | – |
| 45 | KNIME | 7 | 0.02% | – |
| 46 | Analytica | 6 | 0.01% | – |
| 47 | Winpepi | 6 | 0.01% | – |
| 48 | Genedata | 5 | 0.01% | – |
| 49 | RapidMiner | 4 | 0.01% | – |
| 50 | MaxStat | 4 | 0.01% | – |
| 51 | Fityk | 3 | 0.01% | – |
| 52 | DataGraph | 3 | 0.01% | – |
| 53 | BMDP | 3 | 0.01% | – |
| 54 | NLOGIT | 2 | 0.00% | – |
| 55 | GAUSS | 2 | 0.00% | – |
⚠ How was the trend calculated?
The 6-year trend is the linear regression coefficient (reported in percent) obtained by regressing “the percent of articles that mention a particular software package each year” onto the “years” variable. This trend was calculated only for statistical packages with more than 100 mentions over the past 6 years, because otherwise, this number will be reflecting the noise more than the trend.
Do beginners and professional scientists use the same statistical packages?
In order to answer this question, I compared the type of statistical software used in articles published in low versus high impact journals.
I collected the journal impact factor for 32,144 of the articles and divided the dataset into 2 parts:
- Research papers published in low impact journals (impact factor ≤ 3): This subset consisted of 16,337 articles.
- Research papers published in high impact journals (impact factor > 3): This subset consisted of 15,807 articles.
I chose the threshold of 3 for no particular reason other than it seamed a reasonable limit, and also separates the dataset into 2 approximately equal subsets in terms of number of articles.
The results were as follows:
Looking at this bar chart, we can conclude that SPSS, SAS and Stata tend to be more popular among beginners and the inverse is true for R and Prism.
Statistical packages frequently used together
Out of a total of 40,582 articles in our dataset, 7,454 (18.4%) reported the use of more than 1 statistical software.
Here’s a table that shows the top 10 pairs of statistical packages frequently used together:
| Pairs | Number of Mentions (Total: 40,582 articles) | Mentions (in Percent) |
| SPSS + Prism | 1,001 | 2.47% |
| SPSS + R | 888 | 2.19% |
| R + Prism | 816 | 2.01% |
| SPSS + Excel | 684 | 1.69% |
| SAS + JMP | 463 | 1.14% |
| SPSS + Matlab | 432 | 1.06% |
| Prism + Excel | 355 | 0.87% |
| R + Matlab | 325 | 0.80% |
| R + SAS | 306 | 0.75% |
| R + Excel | 298 | 0.73% |
I don’t think there is much to interpret here, as the top 3 most used statistical packages are also the ones frequently used together.
So which statistical software should you choose?
A statistical package can influence the way you approach a statistics problem.
It is not only the violin that shapes the violinist, we are all shaped by the tools we train ourselves to use.
Edsger Dijkstra
When selecting a statistical tool, it is important to consider the following 4 points:
- Popularity: The popularity of any kind of software affects how much it will get updated, and therefore is a good predictor of how much relevant it will be in the future.
- Cost: When it comes to statistical software, “free” does not always mean lower quality, instead some of the free and open source options have the same, sometimes even higher, quality than their paid alternatives.
- Interface: Although many statistical packages are marketed as simple, easy-to-use, and can perform a fully automated statistical analysis, if you want to work professionally with real-world data, you will have to learn how to code and you will need a tool that allows you to do so. That being said, you don’t need to be an expert programmer for most tasks, just knowing the basics will set you apart from your peers.
- Flexibility: Stay away from tools that have an esoteric syntax and always prefer those that have much in common with others as you may at some point find yourself out of your comfort zone, working with different kinds of tools. For instance, although I prefer using R for everything related to statistics, I chose Python for analyzing data for this article, and JavaScript for creating visualizations. The key takeaway is to get yourself to become flexible enough to choose the best tool for the job instead of being forced to modify your projects just for the sake of working with your preferred tool.
References
- Comeau DC, Wei CH, Islamaj Doğan R, and Lu Z. PMC text mining subset in BioC: about 3 million full text articles and growing, Bioinformatics, btz070, 2019.
Further reading
- How to Write & Publish a Research Paper: Step-by-Step Guide
- Checking the Popularity of 125 Statistical Tests and Models
- How Long Should a Research Paper Be? Data from 61,519 Examples
- Programming Languages Popularity in 12,086 Research Papers
- How Many References to Cite? Based on 96,685 Research Papers
- How Old Should References Be? Based on 3,823,919 Examples