In this article, we will cover how to apply the function summarize() from the dplyr package using the following data:
library(dplyr)

# create a tibble (like a data.frame)
my_df <- tibble(
  gender = c('male', 'female', 'male', 'female'),
  age = c(20, 21, 30, 27),
  weight = c(60, 55, 73, NA)
  )

my_df
## A tibble: 4 x 3
#  gender   age weight
#  <chr>  <dbl>  <dbl>
#1 male      20     60
#2 female    21     55
#3 male      30     73
#4 female    27     NA
1. Summarizing a variable
Use the following code to calculate the average age in our dataset:
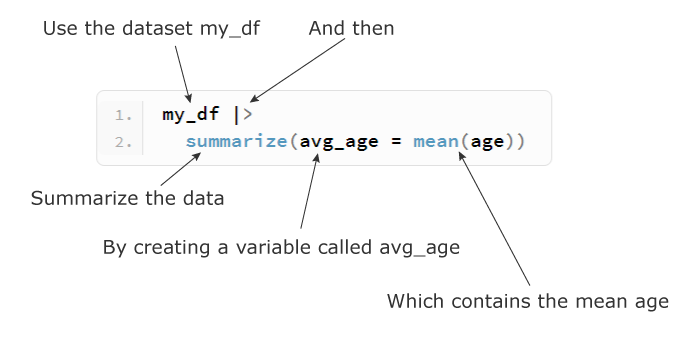
my_df |>
  summarize(avg_age = mean(age))

## A tibble: 1 x 1
#  avg_age
#    <dbl>
#1    24.5
The summarize() function can take many arguments:
my_df |>
  summarize(min_age = min(age), # minimum
            median_age = median(age), # median
            max_age = max(age), # maximum
            avg_age = mean(age), # average
            sd_age = sd(age), # standard deviation
            count = n()) # nb of observations

## A tibble: 1 x 6
#  min_age median_age max_age avg_age sd_age count
#    <dbl>      <dbl>   <dbl>   <dbl>  <dbl> <int>
#1      20         24      30    24.5   4.80     4
2. Grouping and summarizing
Use the following code to calculate the average age in each gender category:
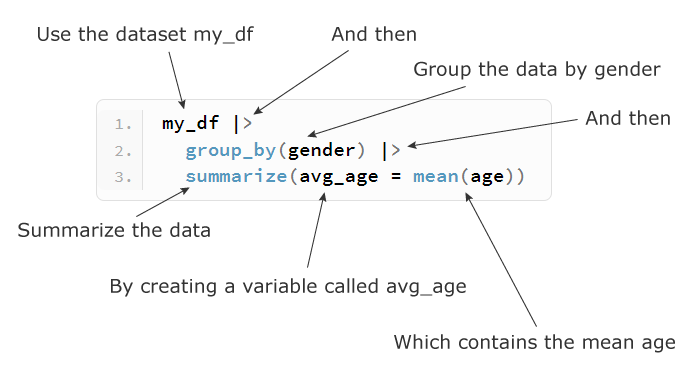
my_df |>
  group_by(gender) |>
  summarize(avg_age = mean(age))

## A tibble: 2 x 2
#  gender avg_age
#  <chr>    <dbl>
#1 female      24
#2 male        25
3. Dealing with missing values
The variable weight contains a missing value, so calculating the average weight for each gender category using the following code produces an NA value:
my_df |>
  group_by(gender) |>
  summarize(avg_weight = mean(weight))

## A tibble: 2 x 2
#  gender avg_weight
#  <chr>       <dbl>
#1 female       NA
#2 male         66.5
One simple solution would be to use the na.rm = TRUE argument inside mean() to remove NA values when calculating the average weight:
my_df |>
  group_by(gender) |>
  summarize(avg_weight = mean(weight, na.rm = TRUE))

## A tibble: 2 x 2
#  gender avg_weight
#  <chr>       <dbl>
#1 female       55
#2 male         66.5
While this code works, it creates another subtle problem which can be illustrated by calculating the average weight and counting the number of values in each gender category:
my_df |>
  group_by(gender) |>
  summarize(avg_weight = mean(weight, na.rm = TRUE),
            count = n())

## A tibble: 2 x 3
#  gender avg_weight count
#  <chr>       <dbl> <int>
#1 female       55       2
#2 male         66.5     2
Notice that the number of observations for the female category is 2 which is misleading because one of them is missing.
To solve this issue, we can remove missing values before calling summarize() by using the function filter(), as follows:
my_df |>
  filter(!is.na(gender) & !is.na(weight)) |>
  group_by(gender) |>
  summarize(avg_weight = mean(weight),
            count = n())

## A tibble: 2 x 3
#  gender avg_weight count
#  <chr>       <dbl> <int>
#1 female       55       1
#2 male         66.5     2
Now it is clear that female has 1 observation and male has 2 observations based on which we calculated the average weights.