Both the linear regression and the regression tree models take as input 1 or more predictors (Xi) and their goal is to explain their relationship with the outcome (Y).
For simplicity, we will consider the case of modeling Y using only 1 predictor X.
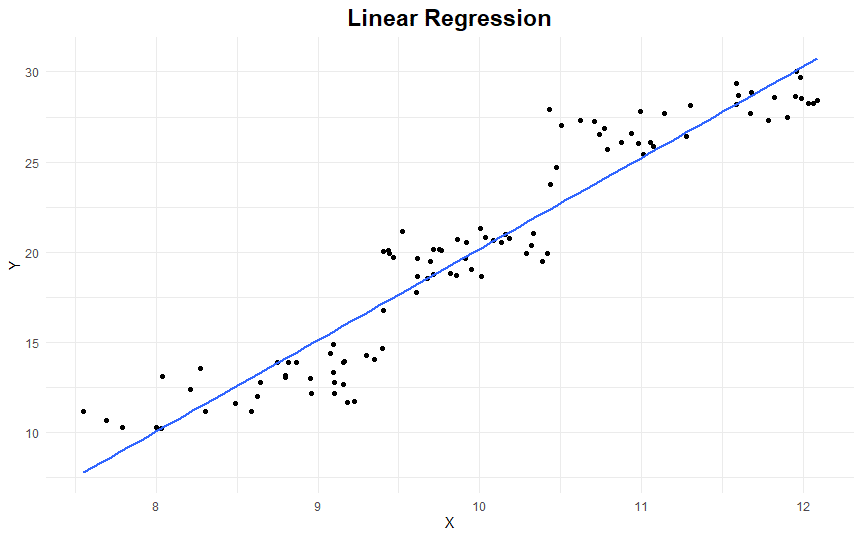
Linear regression tries to find the equation of the line that best fits the data, for instance:
Y = -30.5 + 5X
Here’s what this regression line looks like:
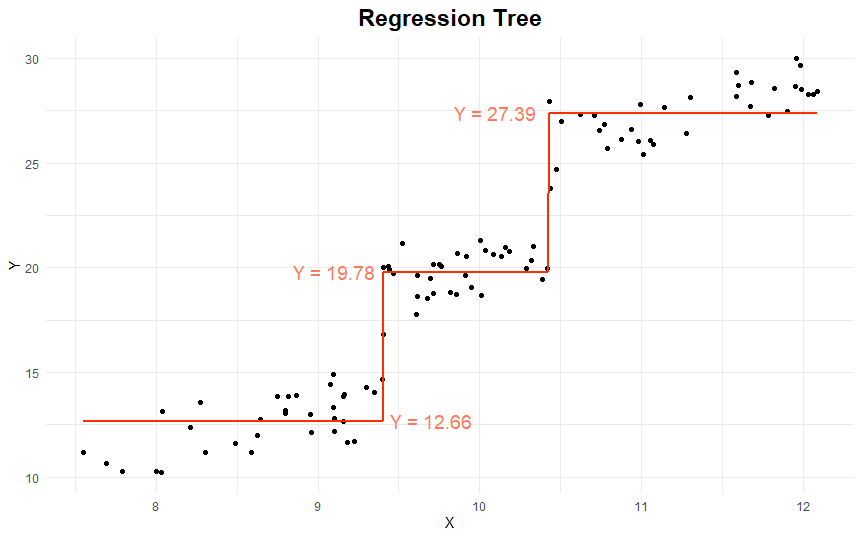
A regression tree, however, tries to find the set of if-else rules that best model the data, for instance:
if X > 10.4, then Y = 27.39
else if X > 9.4, then Y = 19.78
else Y = 12.66
Here’s what this regression tree looks like:
Both linear regression and regression tree are easy to interpret
For both models the effect of X on Y is clear and easy to interpret in comparison with other non-linear models such as support vector machines, random forest, and neural networks. So if your goal is to explain the relationship between X and Y, both linear regression and regression tree will work just fine.
How to interpret a linear regression model?
For example:
Y = -30.5 + 5X
This equation can be interpreted as follows:
An increase of 1 unit in X is associated with an increase of 5 units in Y.
How to interpret a regression tree model?
A regression tree has an even easier interpretation than linear regression and also has a nice graphical representation.
Below is a regression tree that models Blood Pressure (in mmHg) using Age (in years), Smoker (yes/no), and Height (in cm)
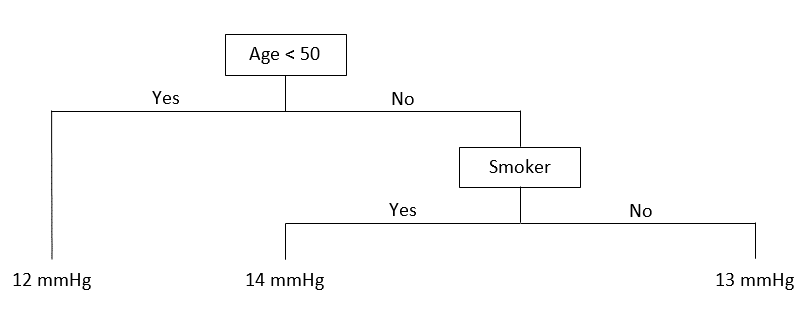
This tree can be interpreted as follows:
Age is the most important predictor of Blood Pressure, and Smoking is the second. The Blood Pressure of young individuals does not seem to be affected by Smoking. But for people older than 50, Smoking is associated with an increase in the mean Blood Pressure from 13 to 14 mmHg. Height however, does not seem to affect the level of Blood Pressure at all.
So which model is better?
This will depend on several factors:
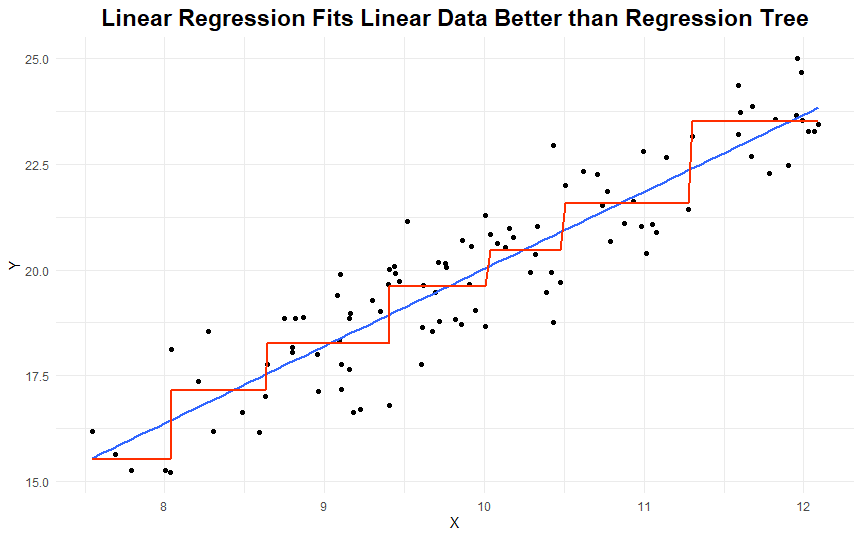
How linear is your data?
If the relationship between X and Y looks linear in a scatterplot, then a linear regression will represent the data better.
Here’s an example:
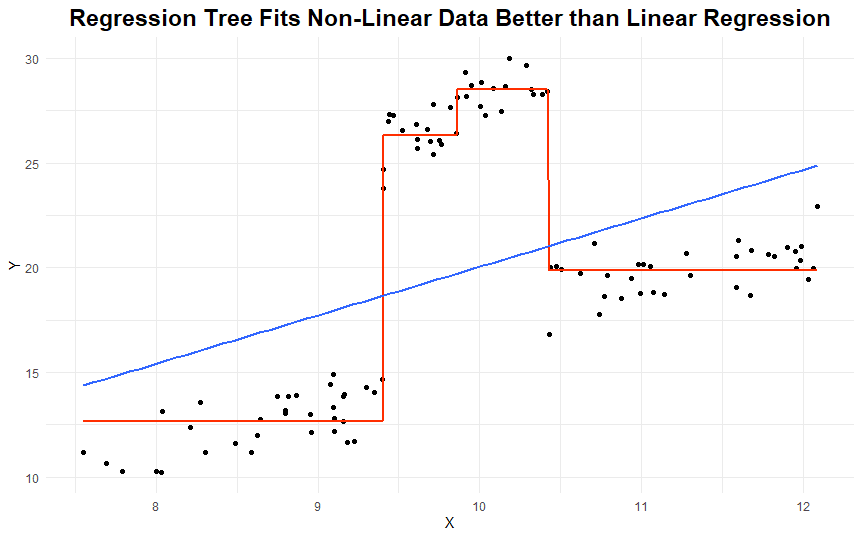
If the relationship is non-linear between X and Y, then a regression tree will probably fit the data better.
Here’s an example:
How flexible can your model be?
The regression tree is a flexible model meaning that a small change in the sample data will result in a large change in the model, so validating the model using a separate dataset (or cross-validation) is very important.
Linear regression however, is a very robust model meaning that a small change in the sample data will not affect the linear regression equation so much (especially if you followed the 10: 1 rule, which states that you need 10 observations for each predictor in the model).
How accurate do you want your predictions to be?
If your goal is to predict Y using X1, X2, X3, etc. with the highest accuracy possible, then neither linear regression nor a regression tree will be your best bet.
In this case, you would be better off using high-variance-low-bias models such as support vector machines, random forest, and neural networks instead. Note however that you will be sacrificing model interpretability as these more complex models are highly-performant black boxes.