A Chi-square goodness-of-fit test is used to evaluate the distribution of a categorical variable with more than 2 levels/categories against a theoretical one. Simply put, we would like to compare the counts in each level of this categorical variable with the counts that we expect to find given some hypothesis.
Therefore, the objective of this test is to quantify how much the observed counts deviate from the theoretical/expected counts.
- the null hypothesis (H0) states that the observed data follow the same theoretical distribution
- the alternative hypothesis (H1) states that the observed data follow a different distribution than the theoretical one
So after running the Chi-square goodness-of-fit test:
- a p-value < 0.05 means that the data provide sufficient evidence against the null hypothesis, so we can conclude that the variable X does not follow the theoretical distribution.
- a p-value > 0.05 means that we don’t have enough evidence to reject the null hypothesis, so we can conclude that the data are consistent with the theoretical percentages.
Information that should be reported
When reporting a Chi-square goodness-of-fit test, the following information should be mentioned in the METHODS section:
- the assumptions of the Chi-square test (the observations should be drawn independently from the population, and each level of the categorical variable must contain at least 5 observations)
- the objective of the test
- the threshold for statistical significance (generally set at 0.05).
And the following should be mentioned in the RESULTS section:
- the results of the Chi-square test:
- the value of the Chi-square statistic
- the degrees of freedom (equal to the number of levels of the categorical variable minus 1, for instance, a categorical variable with 3 levels will have 2 degrees of freedom)
- and the p-value
- the consequence/interpretation of these results
Example: Studying the leading causes of death
In this example we will compare some fake numbers that will represent the “observed distribution” of the 3 leading causes of death (so a categorical variable with 3 levels) with a “theoretical distribution” reported in Ahmad et al..
What you should include in the METHODS section of the research paper:
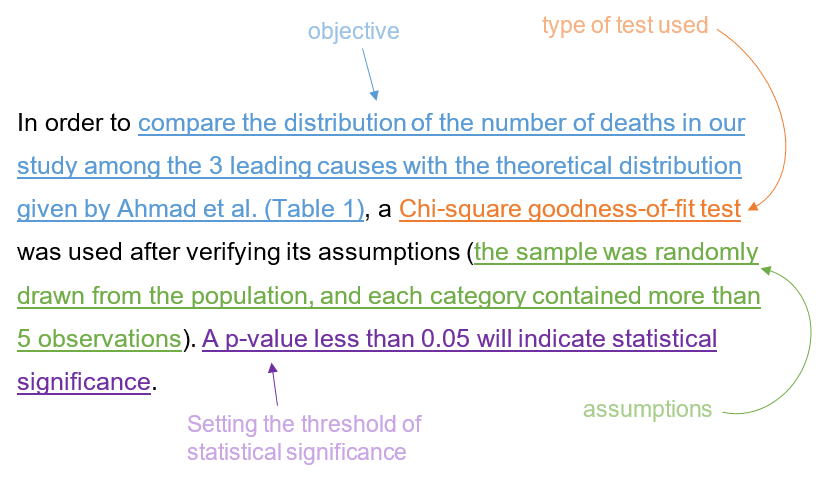
Here’s how to report the use of a Chi-square goodness-of-fit test:
In order to compare the distribution of the number of deaths in our study among the 3 leading causes with the theoretical distribution given by Ahmad et al. (Table 1), a Chi-square goodness-of-fit test was used after verifying its assumptions (the sample was randomly drawn from the population, and each category contained more than 5 observations). A p-value less than 0.05 will indicate statistical significance.
Table 1: According to Ahmad et al., in 2020 in the US the 3 leading causes of death were: Heart Disease, Cancer and COVID-19.
| Causes of Death | Heart Disease | Cancer | COVID-19 |
|---|---|---|---|
| Proportions (according to Ahmad et al.) | 20.5% | 17.8% | 10.3% |
What you should include in the RESULTS section of the research paper:
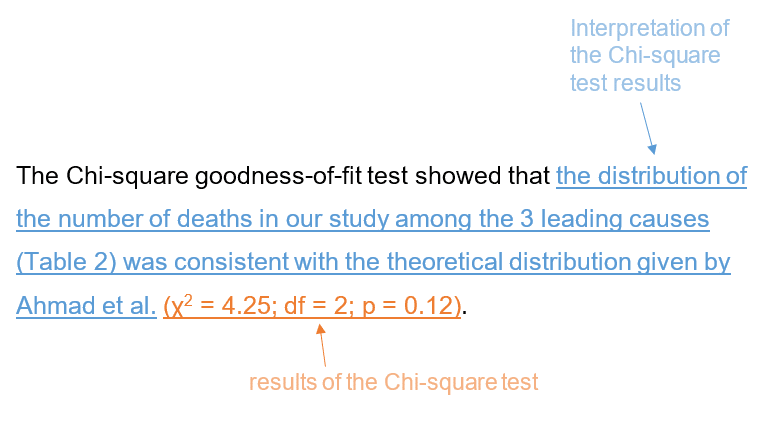
Here’s how to report the results of a Chi-square goodness-of-fit test:
The Chi-square goodness-of-fit test showed that the distribution of the number of deaths in our study among the 3 leading causes (Table 2) was consistent with the theoretical distribution given by Ahmad et al. (χ2 = 4.25; df = 2; p = 0.12).
Table 2: Comparing the expected counts calculated for a sample of 100 observations with the real counts observed in our study.
| Causes of Death | Heart Disease | Cancer | COVID-19 |
|---|---|---|---|
| Expected Counts (based on Ahmad et al.) | 20 | 18 | 10 |
| Observed Counts (data from our study) | 15 | 21 | 15 |