The Shapiro-Wilk test is a statistical test used to check if a continuous variable follows a normal distribution. The null hypothesis (H0) states that the variable is normally distributed, and the alternative hypothesis (H1) states that the variable is NOT normally distributed. So after running this test:
- If p ≤ 0.05: then the null hypothesis can be rejected (i.e. the variable is NOT normally distributed).
- If p > 0.05: then the null hypothesis cannot be rejected (i.e. the variable MAY BE normally distributed).
Information that should be reported
When reporting the Shapiro-Wilk test, the following should be mentioned:
- The reason why the test was used.
- The results of the test: the value of the test statistic W and the p-value associated with it.
- The consequences/interpretation of these results.
Here are 2 examples:
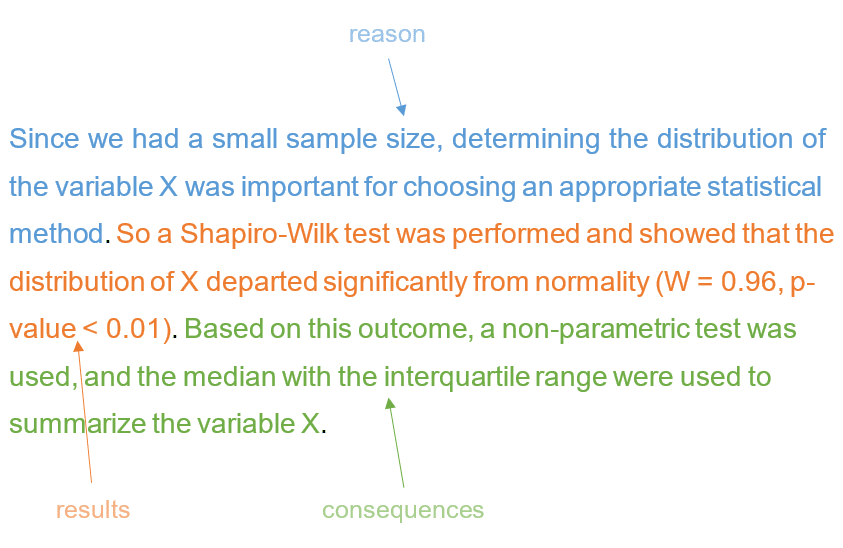
Example 1: Reporting a Shapiro-Wilk test with p ≤ 0.05
Since we had a small sample size, determining the distribution of the variable X was important for choosing an appropriate statistical method. So a Shapiro-Wilk test was performed and showed that the distribution of X departed significantly from normality (W = 0.96, p-value < 0.01). Based on this outcome, a non-parametric test was used, and the median with the interquartile range were used to summarize the variable X.
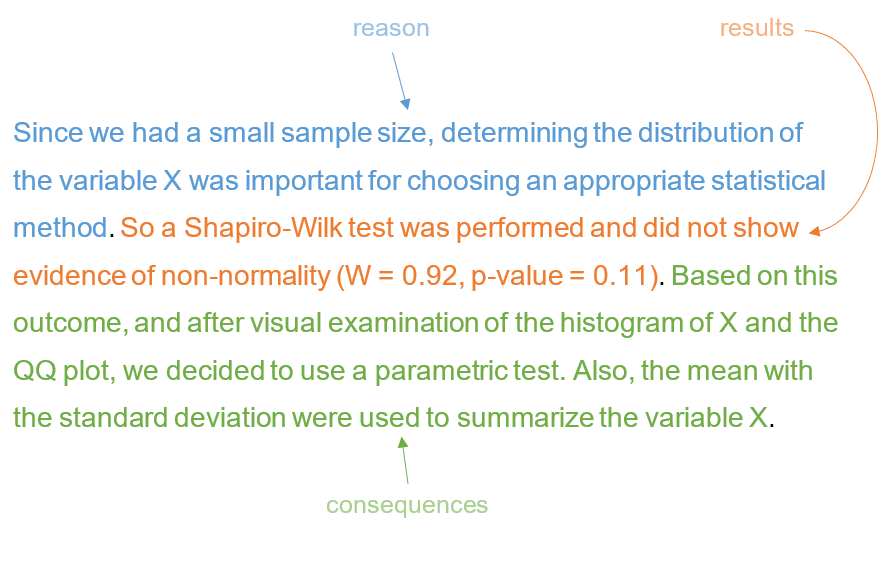
Example 2: Reporting a Shapiro-Wilk test with p > 0.05
Since we had a small sample size, determining the distribution of the variable X was important for choosing an appropriate statistical method. So a Shapiro-Wilk test was performed and did not show evidence of non-normality (W = 0.92, p-value = 0.11). Based on this outcome, and after visual examination of the histogram of X and the QQ plot, we decided to use a parametric test. Also, the mean with the standard deviation were used to summarize the variable X.
Important notes for reporting a Shapiro-Wilk test
1. A p > 0.05 does not prove the alternative hypothesis:
A Shapiro-Wilk test with a p > 0.05 does not mean that the variable is normally distributed, it only means that you cannot reject the null hypothesis which states that the variable is normally distributed.
This is why in the example above, where we reported a Shapiro-Wilk test with a p > 0.05, we used the words: “the Shapiro-Wilk test did not show evidence of non-normality“.
So be aware of incorrect interpretations like the following:
- “The Shapiro-Wilk test indicates that the variable has a normal distribution“.
- “The normality assumption was verified using the Shapiro-Wilk test“.
- “Normality of the data was confirmed by a Shapiro-Wilk test“.
- “The distribution of the variable was determined using the Shapiro-Wilk test“.
2. The probability of getting a p < 0.05 depends on the size of your sample
A large enough sample size will make the Shapiro-Wilk test detect the smallest deviation from normality, in this case the p-value will be < 0.05 even if the variable is, in fact, normally distributed. Conversely, a very small sample size will reduce the statistical power of the Shapiro-Wilk test to reject the null hypothesis, in this case the p-value will be ≥ 0.05 even if the data clearly do not come from a normal distribution.
For these reasons many data analysts prefer to assess normality visually and/or using common sense, as sometimes the shape of a distribution can be decided theoretically, especially if the variable has some natural boundaries. For instance, “age” and “bacterial count” cannot have values less than zero, however they may have a very high although improbable upper bound (i.e. a right tail). Therefore, these variables should be ruled as following non-normal distributions.
3. Reporting the results of Shapiro-Wilk tests on many variables
For reporting the results of Shapiro-Wilk tests on many variables, use 1 of the following templates:
Example 1:
The distributions were significantly non-normal for the variables X1 (W = 0.93, p < 0.01), X2 (W = 0.95, p < 0.01), and X3 (W = 0.91, p < 0.01) according to Shapiro-Wilk tests.
Example 2:
Shapiro-Wilk tests showed that neither X1 (W = 0.93, p < 0.01) nor X2 (W = 0.95, p < 0.01) were normally distributed.