Here’s a table that summarizes the similarities and differences between risk and rate:
(Note that the text below contains all the necessary details to understand this table)
| Risk | Rate | |
|---|---|---|
| Definition | Proportion of individuals who developed the disease over a specified period of time (the follow-up period) | Proportion of individuals who developed the disease over a specified period of time per total person-time |
| Numerator | Number of new cases discovered over the follow-up period | Number of new cases discovered over the follow-up period |
| Denominator | Number of disease-free individuals at the start of the follow-up period | Total person-time contributed by disease-free individuals |
| Units | [dimensionless] | 1 / time |
| Example | 12% of US women (1 woman in 8) will develop breast cancer over the course of their lifetime [Source] | In the province of KwaZulu Natal in South Africa, the rate of HIV infection is 2.6 new cases per 100 person-years for the period 2004 to 2011 [Source] |
| Range | [0-1] | [0-∞) |
| Advantages | Measures how many new cases we have. Useful for studying the effect of a risk factor and the cause of a disease | Same benefits, but especially useful in cases where we could not follow participants for the whole specified period either because of loss to follow-up or competing risks (death) |
| Limitations | Need to follow all participants for the same period of time, death and loss to follow-up cause problems in estimating risk | The concept of person-time is a little bit hard to interpret by non-professionals |
Risk
The following video explains risk, how to calculate it, and its advantages and limitations:
Risk (a.k.a. cumulative incidence or incidence risk) is the number of new disease cases that occur over a specified time period in a population at risk of having the disease.
How to calculate risk?

Numerator: Number of people who CHANGED STATUS from not having the disease to having it over the specified period of time. Those who are already sick at the start of the period should NOT be included.
Denominator: Number of disease-free individuals AT THE START of the time period, these are people at risk of having the disease but are not yet sick.
Risk ranges from 0 to 1:
- Risk = 0 means that there are no new cases of the disease during the defined period
- Risk = 1 means that all the study population developed the disease during the defined period
Whenever you talk about risk, never forget to specify the time period.
Here’s an example:
A 55-year-old man who smokes has about the same 10-year risk of death from all causes as a 65-year-old man who never smoked (i.e. 178 vs 176 in 1000).
Source
In this example the authors calculated 2 risks:
1- For those who smoked:
- The time period is 10 years
- The numerator is the number of 55-year-old men who smoked and died within the next 10 years
- The denominator is the number of 55-year-old men who smoked (i.e. a smoker, who is a men, aged 55 and not dead)
2- The second risk is calculated in the same manner but for non-smokers.
In this example the risk was presented as number of death per 1000 men, note that it could have been reported as a percentage (i.e. 178 / 1000 = 17.8%).
When to use risk?
Risk is especially useful when studying the effect of an exposure, as in the example above where we compared the risk of death for smokers versus non-smokers.
When to avoid using risk?
Avoid using risk when:
- The follow-up period is not the same for all participants
- New participants enter the group during the follow-up period
- We have a lot of loss to follow-up
- We have competing risks (e.g. death — when we’re calculating a risk other than the risk of death)
Rate
The following video explains rate, how to calculate it, and its advantages and limitations:
Rate (a.k.a incidence rate) is the number of new disease cases that occur over a specified time period per total person-time.
How to calculate rate?

Numerator: Number of people who CHANGED STATUS from not having the disease to having it over the specified period of time. Those who are already sick at the start of the period should NOT be included.
Note: This is the same numerator used for calculating risk.
Denominator: Total person-time contributed by disease-free individuals. Total person-time is the sum of time (hours / days / years) that each person spent from the time they entered the study until they get the disease, die, become lost to follow-up or the follow-up period ends.
How to calculate person-time?
To better understand the concept of person-time consider the following example:
Suppose we followed 5 participants for a period of 8 years.
Using the figure below, calculate the rate of the disease during that period.
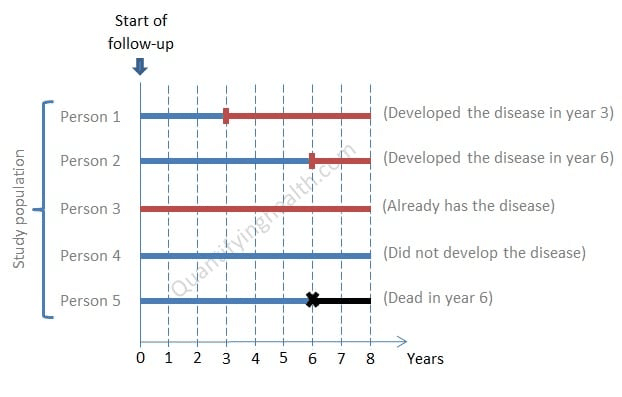
In this example, the numerator should be 2, since only participants 1 and 2 developed the disease during the period of follow-up.
The denominator is the total person-years contributed by disease-free participants:
- Person 1 contributed 3 years of disease-free follow-up.
- Person 2 contributed 6 years.
- Person 3 already has the disease so contributed 0 years of disease-free follow-up.
- Person 4 contributed all 8 years.
- Person 5 contributed 6 years before dying.
So…
Total person-years = 3 + 6 + 0 + 8 + 6 = 18
Rate = 2 / 23 = 0.087
Otherwise stated the rate of the disease is 87 per 1000 person-years.
Note: Rate ranges form 0 to infinity since the numerator can be bigger than the denominator.
When to use rate?
Using rate addresses the problems we saw with risk:
- When participants cannot be followed for the full specified period.
- When participants enter and leave the study as we follow them.
- To handle loss to follow-up and competing risks (death).
When to avoid using rate?
Because the concept of person-time is hard to wrap our heads around, the rate of a disease (or any health event) is more interpretable when we compare it to another rate, as in:
As of 2016, the cancer death rate for men and women combined had fallen 27% from its peak in 1991
Cancer.org