Statistical power is a measure of study efficiency, calculated before conducting the study to estimate the chance of discovering a true effect rather than obtaining a false negative result, or worse, overestimating the effect by detecting the noise in the data.
Here are 5 seemingly different, but actually similar, ways of describing statistical power:
Definition #1: Statistical power is the probability of detecting an effect, assuming that one exists. The effect can be, for example, an association between 2 variables of interest.
Definition #2: Statistical power is the probability of achieving statistical significance (typically a p-value < 0.05), when testing a real phenomenon or effect.
Definition #3: Statistical power is the probability of rejecting the null hypothesis H0, assuming that the alternative hypothesis HA is true.
Definition #4: Statistical power is the probability of making the correct conclusion of rejecting a false null hypothesis.
Definition #5: Statistical power is the probability of avoiding a type II error. A type II error happens if we fail to reject the null hypothesis when we actually should.
– The null hypothesis H0 reflects the idea that there is no effect.
– The alternative hypothesis HA reflects the idea that there is an actual real effect.
Taken together, the null hypothesis and the alternative hypothesis account for all possibilities.
Factors that influence statistical power
The factors that affect the power of a study are:
- The sample size: A larger sample reduces the noise in the data, and therefore increases the chance of detecting an effect, assuming that one exists — so increasing the sample size will increase statistical power.
- The effect size: The larger the effect size (for instance, the difference between 2 treatments A and B), the easier it would be to detect it — so increasing the effect size (e.g. by increasing the dose of the treatment) will increase statistical power.
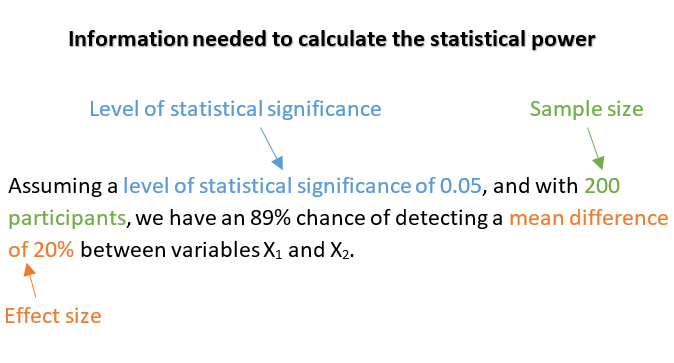
- The level of statistical significance α: The level of statistical significance is generally set at 0.05. The lower the level of statistical significance, the harder it would be to detect an effect — so choosing a higher level of statistical significance will increase statistical power.
Here’s an example:
How statistical power is used in research
In the previous section, we have established that there is a relationship between: power, sample size, effect size and level of statistical significance.
Any of these quantities can be calculated if we know the values of the other 3. But, since the level of statistical significance is usually fixed and not calculated, we are left with 3 types of analyses that we can perform:
- A-priori power analysis: Which consists of calculating the minimum sample size required before conducting the study.
- Sensitivity analysis: Which consists of calculating the smallest detectable effect size after conducting the study.
- Post-hoc power analysis: Which consists of calculating the statistical power after conducting the study.
Note that these calculations can be quite complicated to do by hand, therefore, I recommend using G*Power, R, or other statistical software to perform these analyses.
1. A-priori power analysis
An a-priori power analysis is done before conducting the study, with the objective of calculating the minimum sample size needed to detect an effect with a certain specified power.
In order to perform an a-priori analysis, we need to specify:
- The statistical power: A fixed number that we aim to achieve (most researchers consider 80% a good threshold to aim for).
- The level of statistical significance: The alpha level that we will use in the study (usually set at 0.05).
- The effect size: A guess of what the true effect size is in the population of interest.
In practice, guessing the true effect size in the population before conducting the study is quite difficult, since if we already know the size of the effect, we wouldn’t be doing the study in the first place.
Common solutions to this problem are:
Solution #1: Perform a pilot study in order to determine the effect size.
The problem with this solution is that the estimate of the effect size will be highly unstable, since the sample size in the pilot study is very small by definition.
Solution #2: Use the smallest effect size instead of the true effect size.
Specifying the smallest effect size that actually matters will be easier than guessing the true effect size in the population. Using this approach, the sample size calculated in the a-priori analysis is said to be “the minimum sample size needed to detect the smallest relevant effect with an 80% power”.
2. Sensitivity analysis
A sensitivity analysis is done after the study is finished, with the objective of calculating the smallest effect that the study can detect given a certain specified power.
In order to perform a sensitivity analysis, we need to specify:
- The statistical power: A fixed number that we aim to achieve (most researchers consider 80% a good threshold to aim for).
- The level of statistical significance: The alpha level used in the study (usually set at 0.05).
- The sample size: The number of participants included in the study.
3. Post-hoc power analysis
A post-hoc power analysis is done after the study is finished, with the objective of calculating the statistical power in order to determine the chance that a study had to detect a true effect.
In order to perform a post-hoc analysis, we need to specify:
- The sample size: The number of participants included in the study.
- The effect size: As reported in the study.
- The level of statistical significance: The alpha level chosen in the study (usually set at 0.05).
A post-hoc power analysis is not important since it does not offer more information than the p-value reported in the study.
Consequences of low statistical power
A low-power study has a high probability of missing out on a scientific discovery, and therefore will have a hard time being approved by funding agencies.
But the problem with a low-power study is more serious than having a high risk of missing out on detecting a true effect. A low-power study also has a high risk of publishing noise — an overestimation of the true effect. In other words, its results will be biased and unlikely to replicate.
References
- Gelman A. Regression and Other Stories. 1st edition. Cambridge University Press; 2020.
- Triola M. Essentials of Statistics. 6th edition. Pearson; 2018.
- Bruce P, Bruce A. Practical Statistics for Data Scientists: 50 Essential Concepts. 1st edition. O’Reilly Media; 2017.
- Improving Your Statistical Questions. Coursera. Accessed October 30, 2021. https://www.coursera.org/learn/improving-statistical-questions