When running a multiple linear regression model:
Y = β0 + β1X1 + β2X2 + β3X3 + β4X4 + … + ε
The F-statistic provides us with a way for globally testing if ANY of the independent variables X1, X2, X3, X4… is related to the outcome Y.
For a significance level of 0.05:
- If the p-value associated with the F-statistic is ≥ 0.05: Then there is no relationship between ANY of the independent variables and Y
- If the p-value associated with the F-statistic < 0.05: Then, AT LEAST 1 independent variable is related to Y
Below we will go through 2 special case examples to discuss why we need the F-test and how to interpret it.
Let’s get started!
Why do we even need the F-test?
Why do we need a global test? Why not look at the p-values associated with each coefficient β1, β2, β3, β4… to determine if any of the predictors is related to Y?
Before we answer this question, let’s first look at an example:
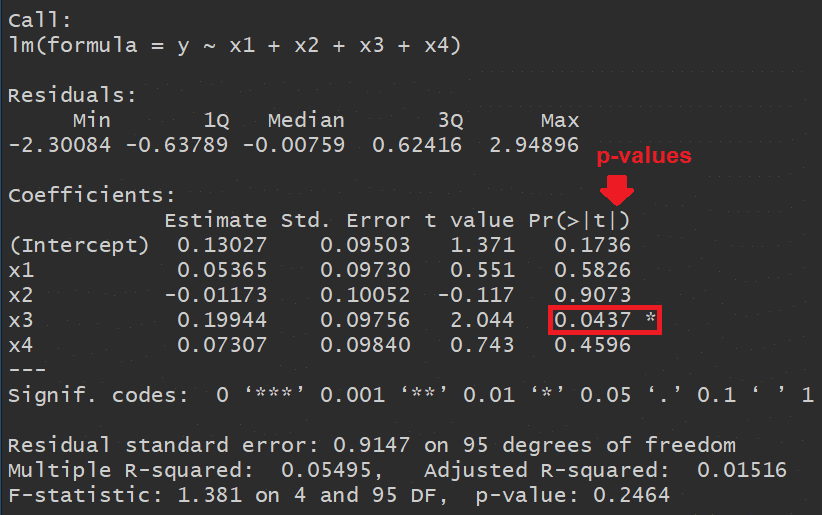
In the image below we see the output of a linear regression in R.
Notice that the coefficient of X3 has a p-value < 0.05 which means that X3 is a statistically significant predictor of Y:
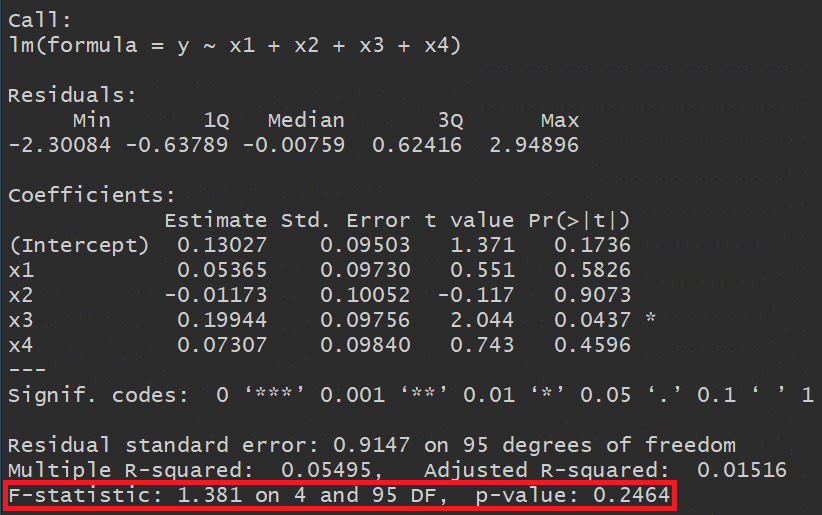
However, the last line shows that the F-statistic is 1.381 and has a p-value of 0.2464 (> 0.05) which suggests that NONE of the independent variables in the model is significantly related to Y!
So is there something wrong with our model? If not, then which p-value should we trust: that of the coefficient of X3 or that of the F-statistic?
The answer is that we cannot decide on the global significance of the linear regression model based on the p-values of the β coefficients.
This is because each coefficient’s p-value comes from a separate statistical test that has a 5% chance of being a false positive result (assuming a significance level of 0.05).
For instance, if we take the example above, we have 4 independent variables (X1 through X4) and each of them has a 5% risk of yielding a p-value < 0.05 just by chance (when in reality they’re not related to Y).
The more variables we have in our model, the more likely it will be to have a p-value < 0.05 just by chance.
Here’s a plot that shows the probability of having AT LEAST 1 variable with p-value < 0.05 when in reality none has a true effect on Y:
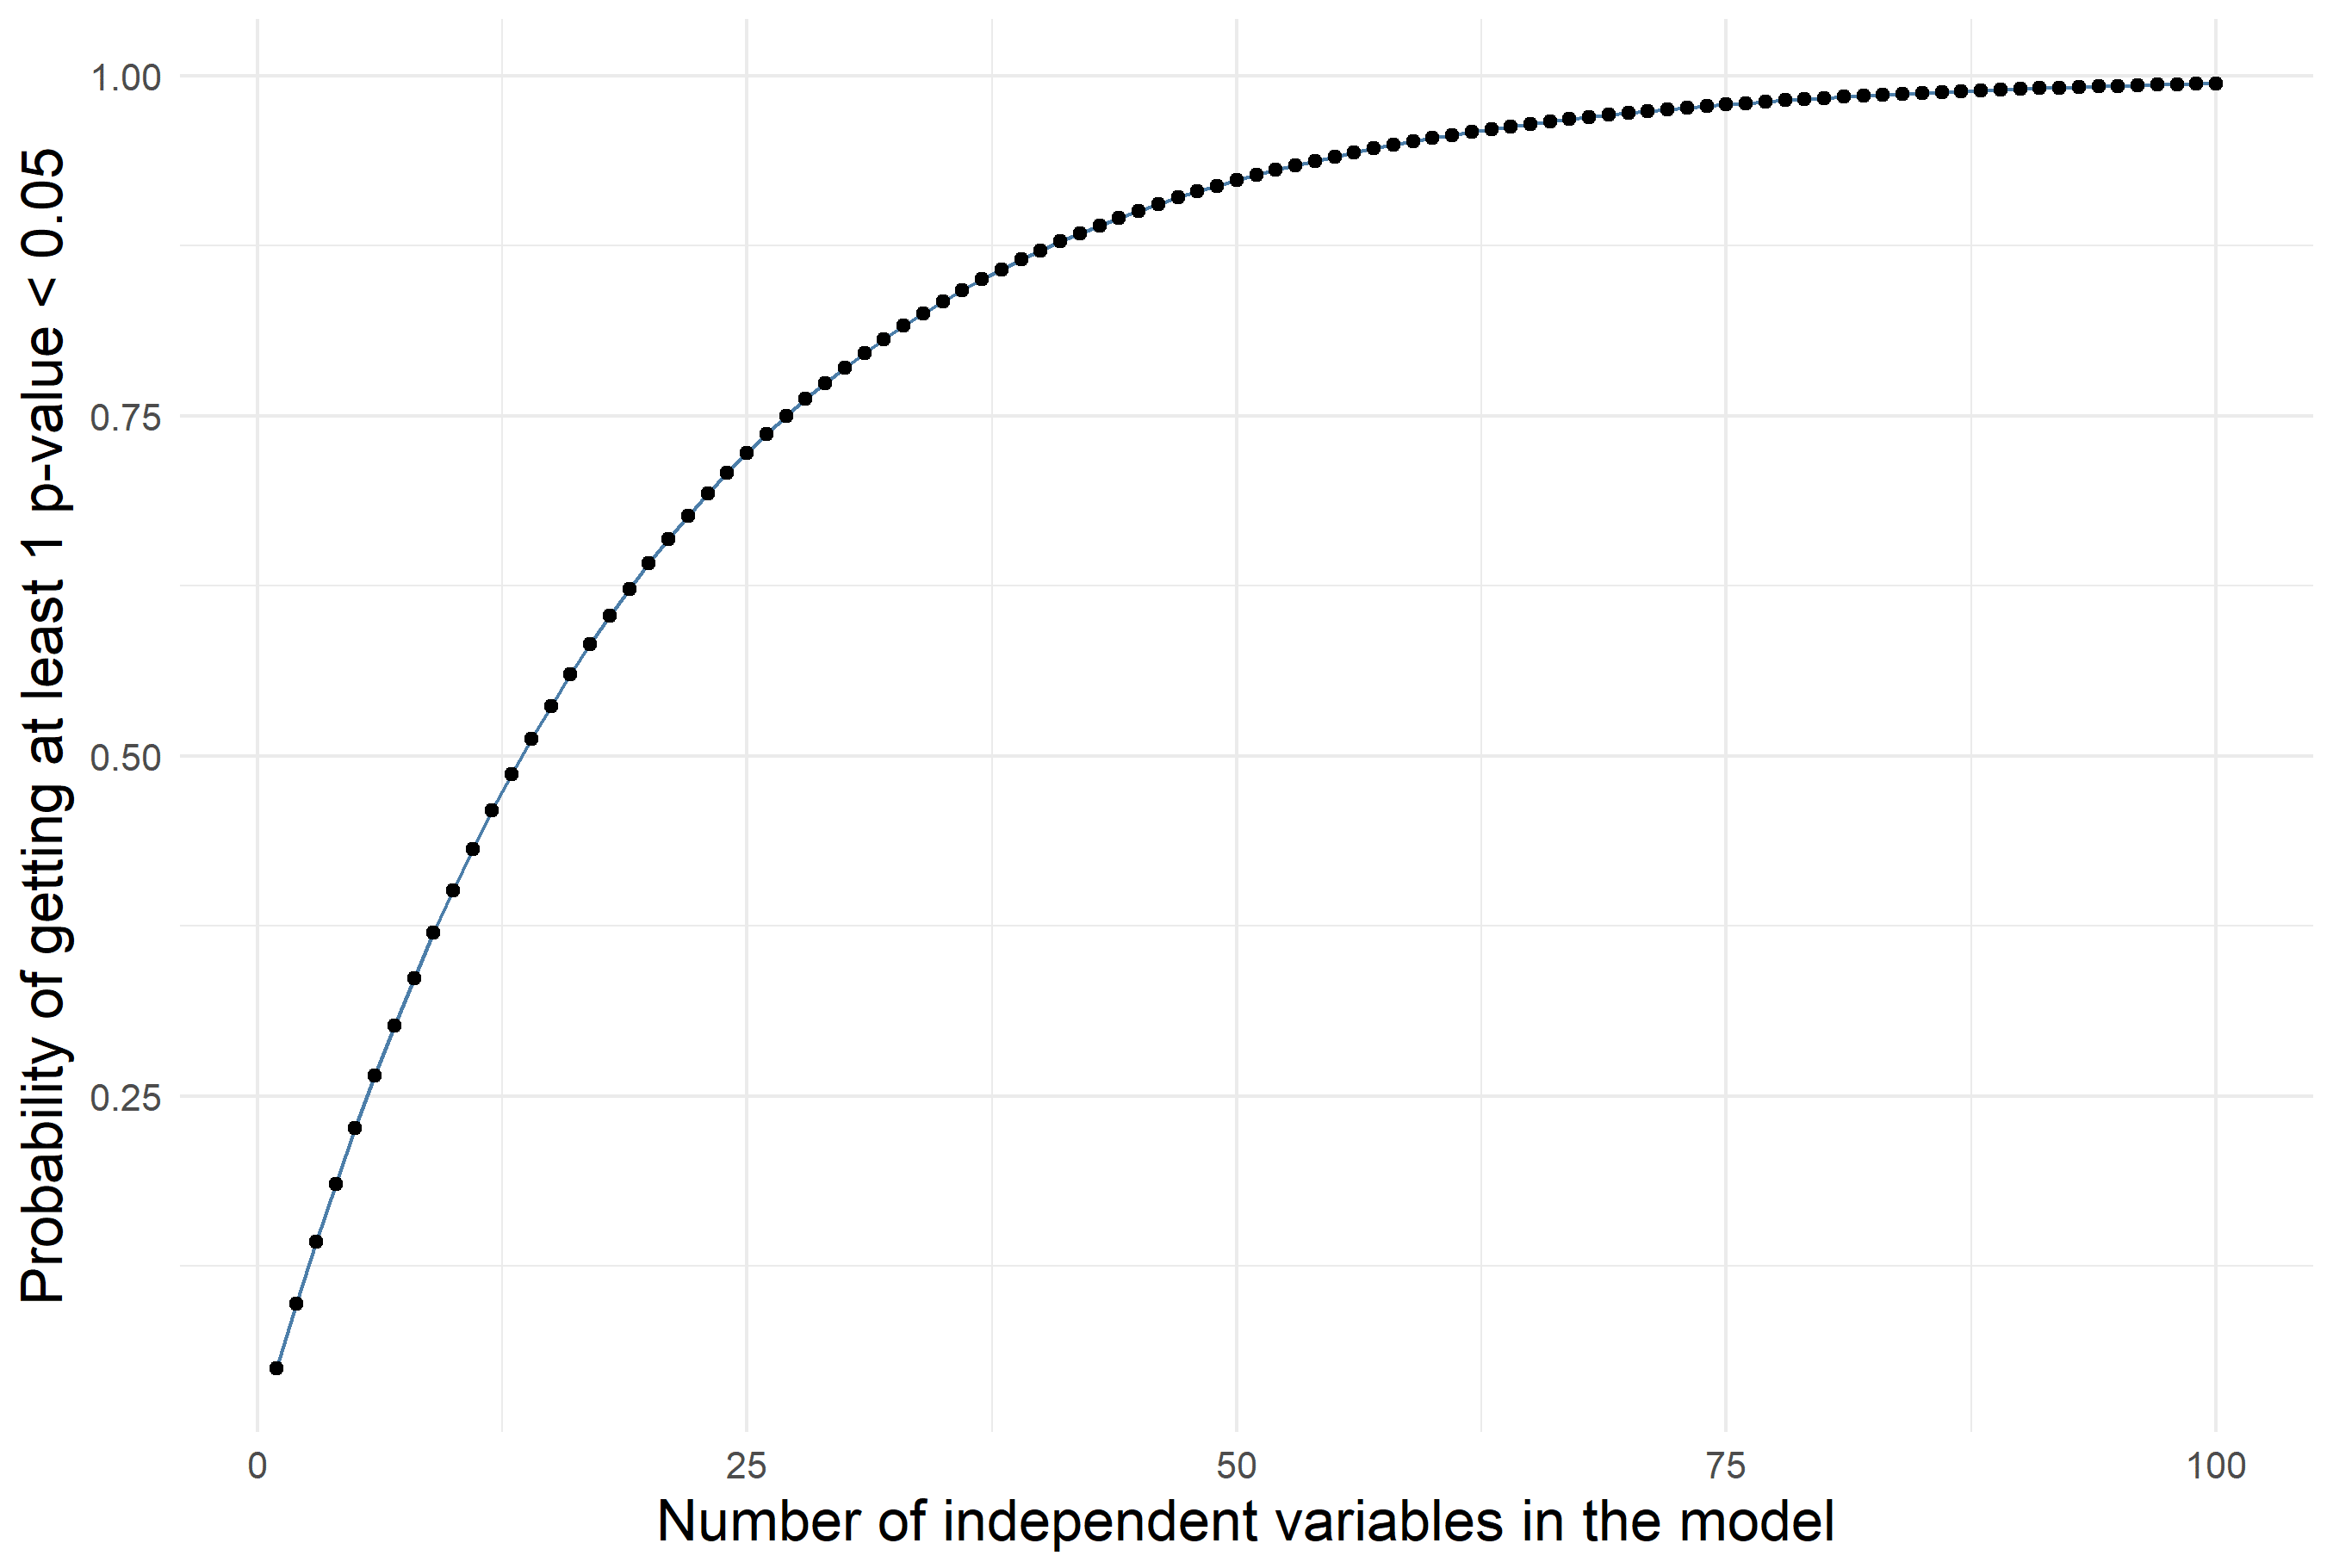
In the plot we see that a model with 4 independent variables has a 18.5% chance of having at least 1 β with p-value < 0.05.
The plot also shows that a model with more than 80 variables will almost certainly have 1 p-value < 0.05.
Therefore it is obvious that we need another way to determine if our linear regression model is useful or not (i.e. if at least one of the Xi variables was important in predicting Y).
Here’s where the F-statistic comes into play.
One important characteristic of the F-statistic is that it adjusts for the number of independent variables in the model. So it will not be biased when we have more than 1 variable in the model.
Returning to our example above, the p-value associated with the F-statistic is ≥ 0.05, which provides evidence that the model containing X1, X2, X3, X4 is not more useful than a model containing only the intercept β0.
BOTTOM LINE:
In this example, according to the F-statistic, none of the independent variables were useful in predicting the outcome Y, even though the p-value for X3 was < 0.05.
What if the F-statistic has a statistically significant p-value but none of the coefficients does?
Here’s the output of another example of a linear regression model where none of the independent variables is statistically significant but the overall model is (i.e. at least one of the variables is related to the outcome Y) according to the p-value associated with the F-statistic.
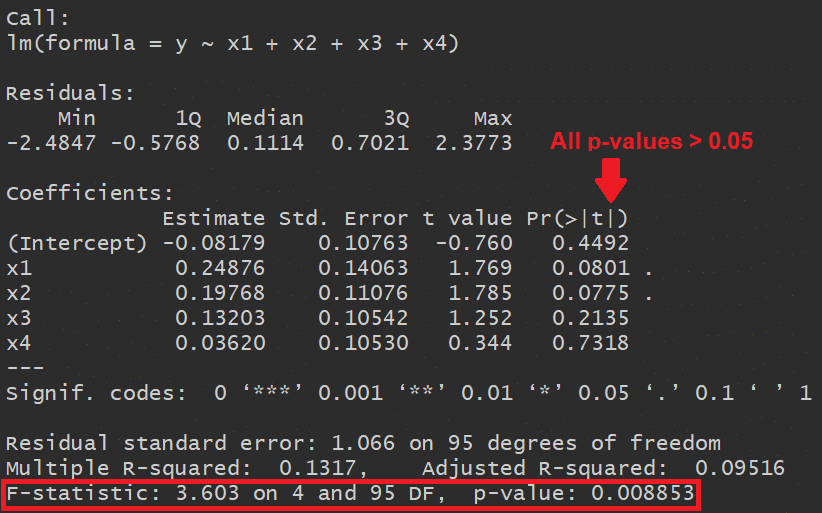
But how is that even possible?
Well, in this particular example I deliberately chose to include in the model 2 correlated variables: X1 and X2 (with correlation coefficient of 0.5).
Because this correlation is present, the effect of each of them was diluted and therefore their p-values were ≥ 0.05, when in reality they both are related to the outcome Y.
CONCLUSION:
When it comes to the overall significance of the linear regression model, always trust the statistical significance of the F-statistic over that of each independent variable.
Reference
James, D. Witten, T. Hastie, and R. Tibshirani, Eds., An introduction to statistical learning: with applications in R. New York: Springer, 2013.