Handling missing data involves 2 steps:
- Determining the type of missing data, which can be:
- Missing completely at random (MCAR)
- Missing at random (MAR)
- Missing not at random (MNAR)
- Choosing a method to deal with these missing values, such as:
- Deleting variables (i.e. columns) that contain missing values
- Deleting observations (i.e. rows) whose values are missing
- Replacing (a.k.a. imputing) missing values with reasonable alternatives
- Modeling the missing data mechanism using specialized methods
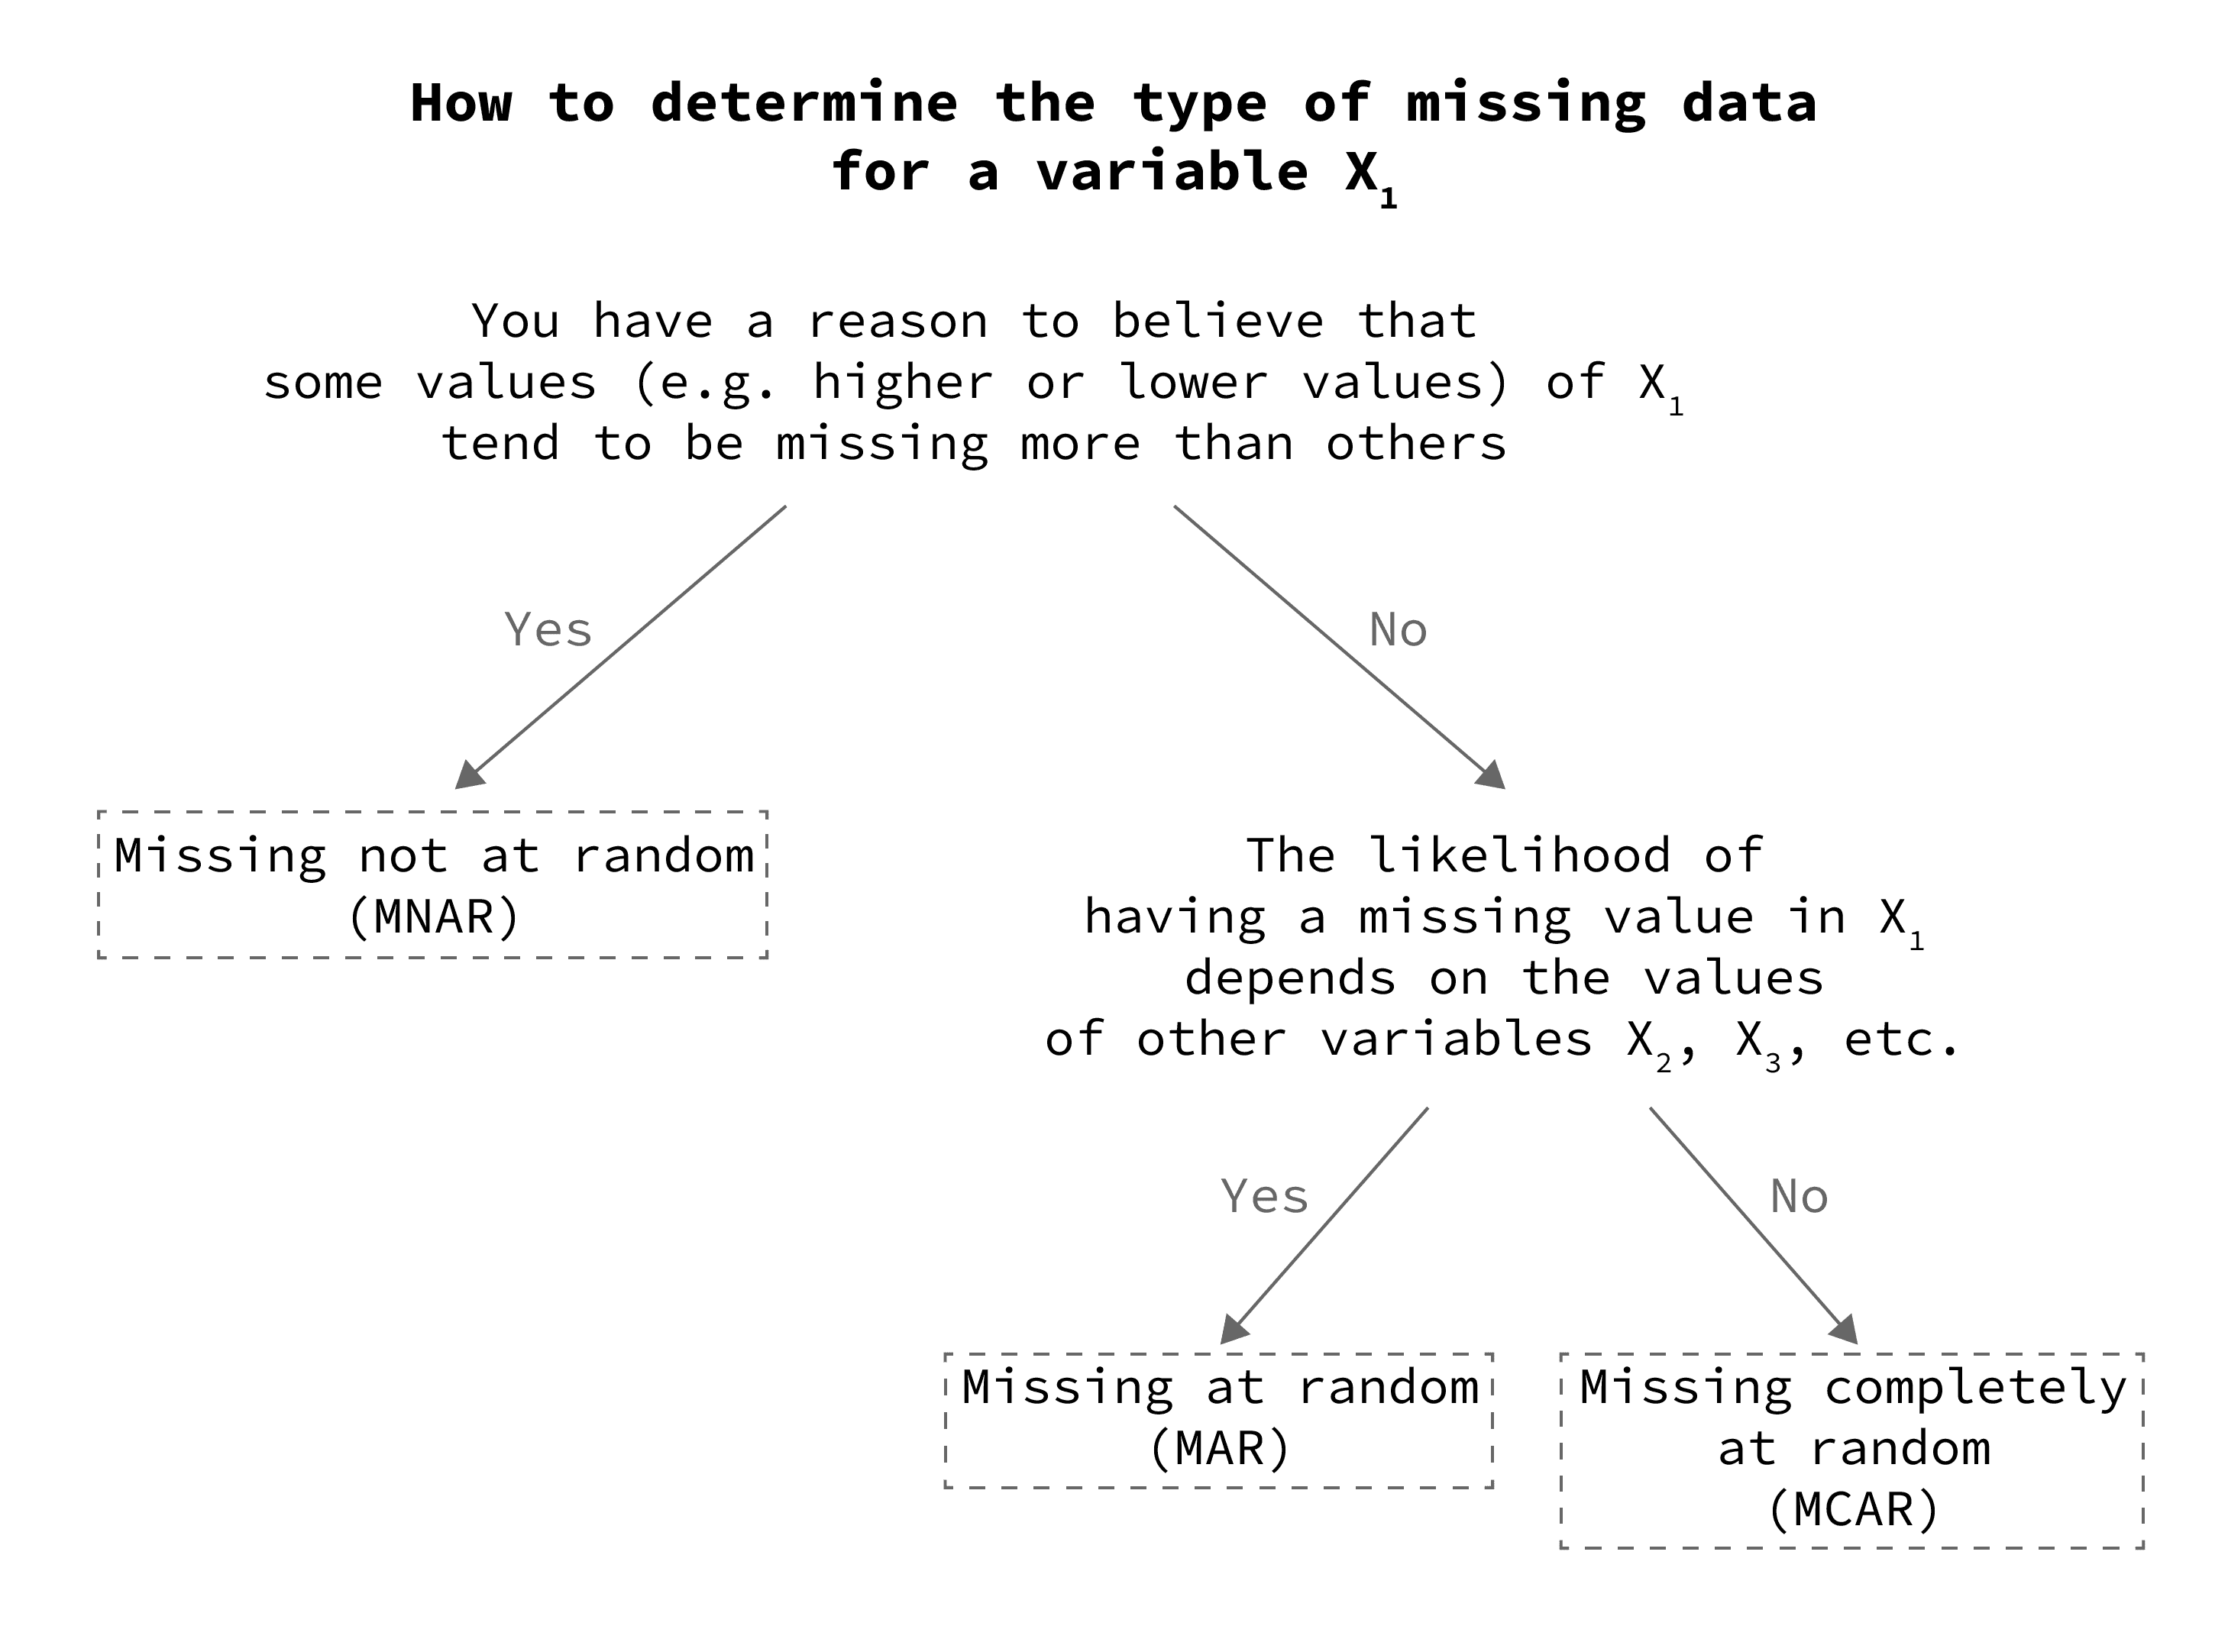
To start, here is a decision tree to help you determine the type of missing data for each variable in your study (step 1):
Next, use information from step 1 and the decision tree below to find the best method to deal with these missing values (step 2):
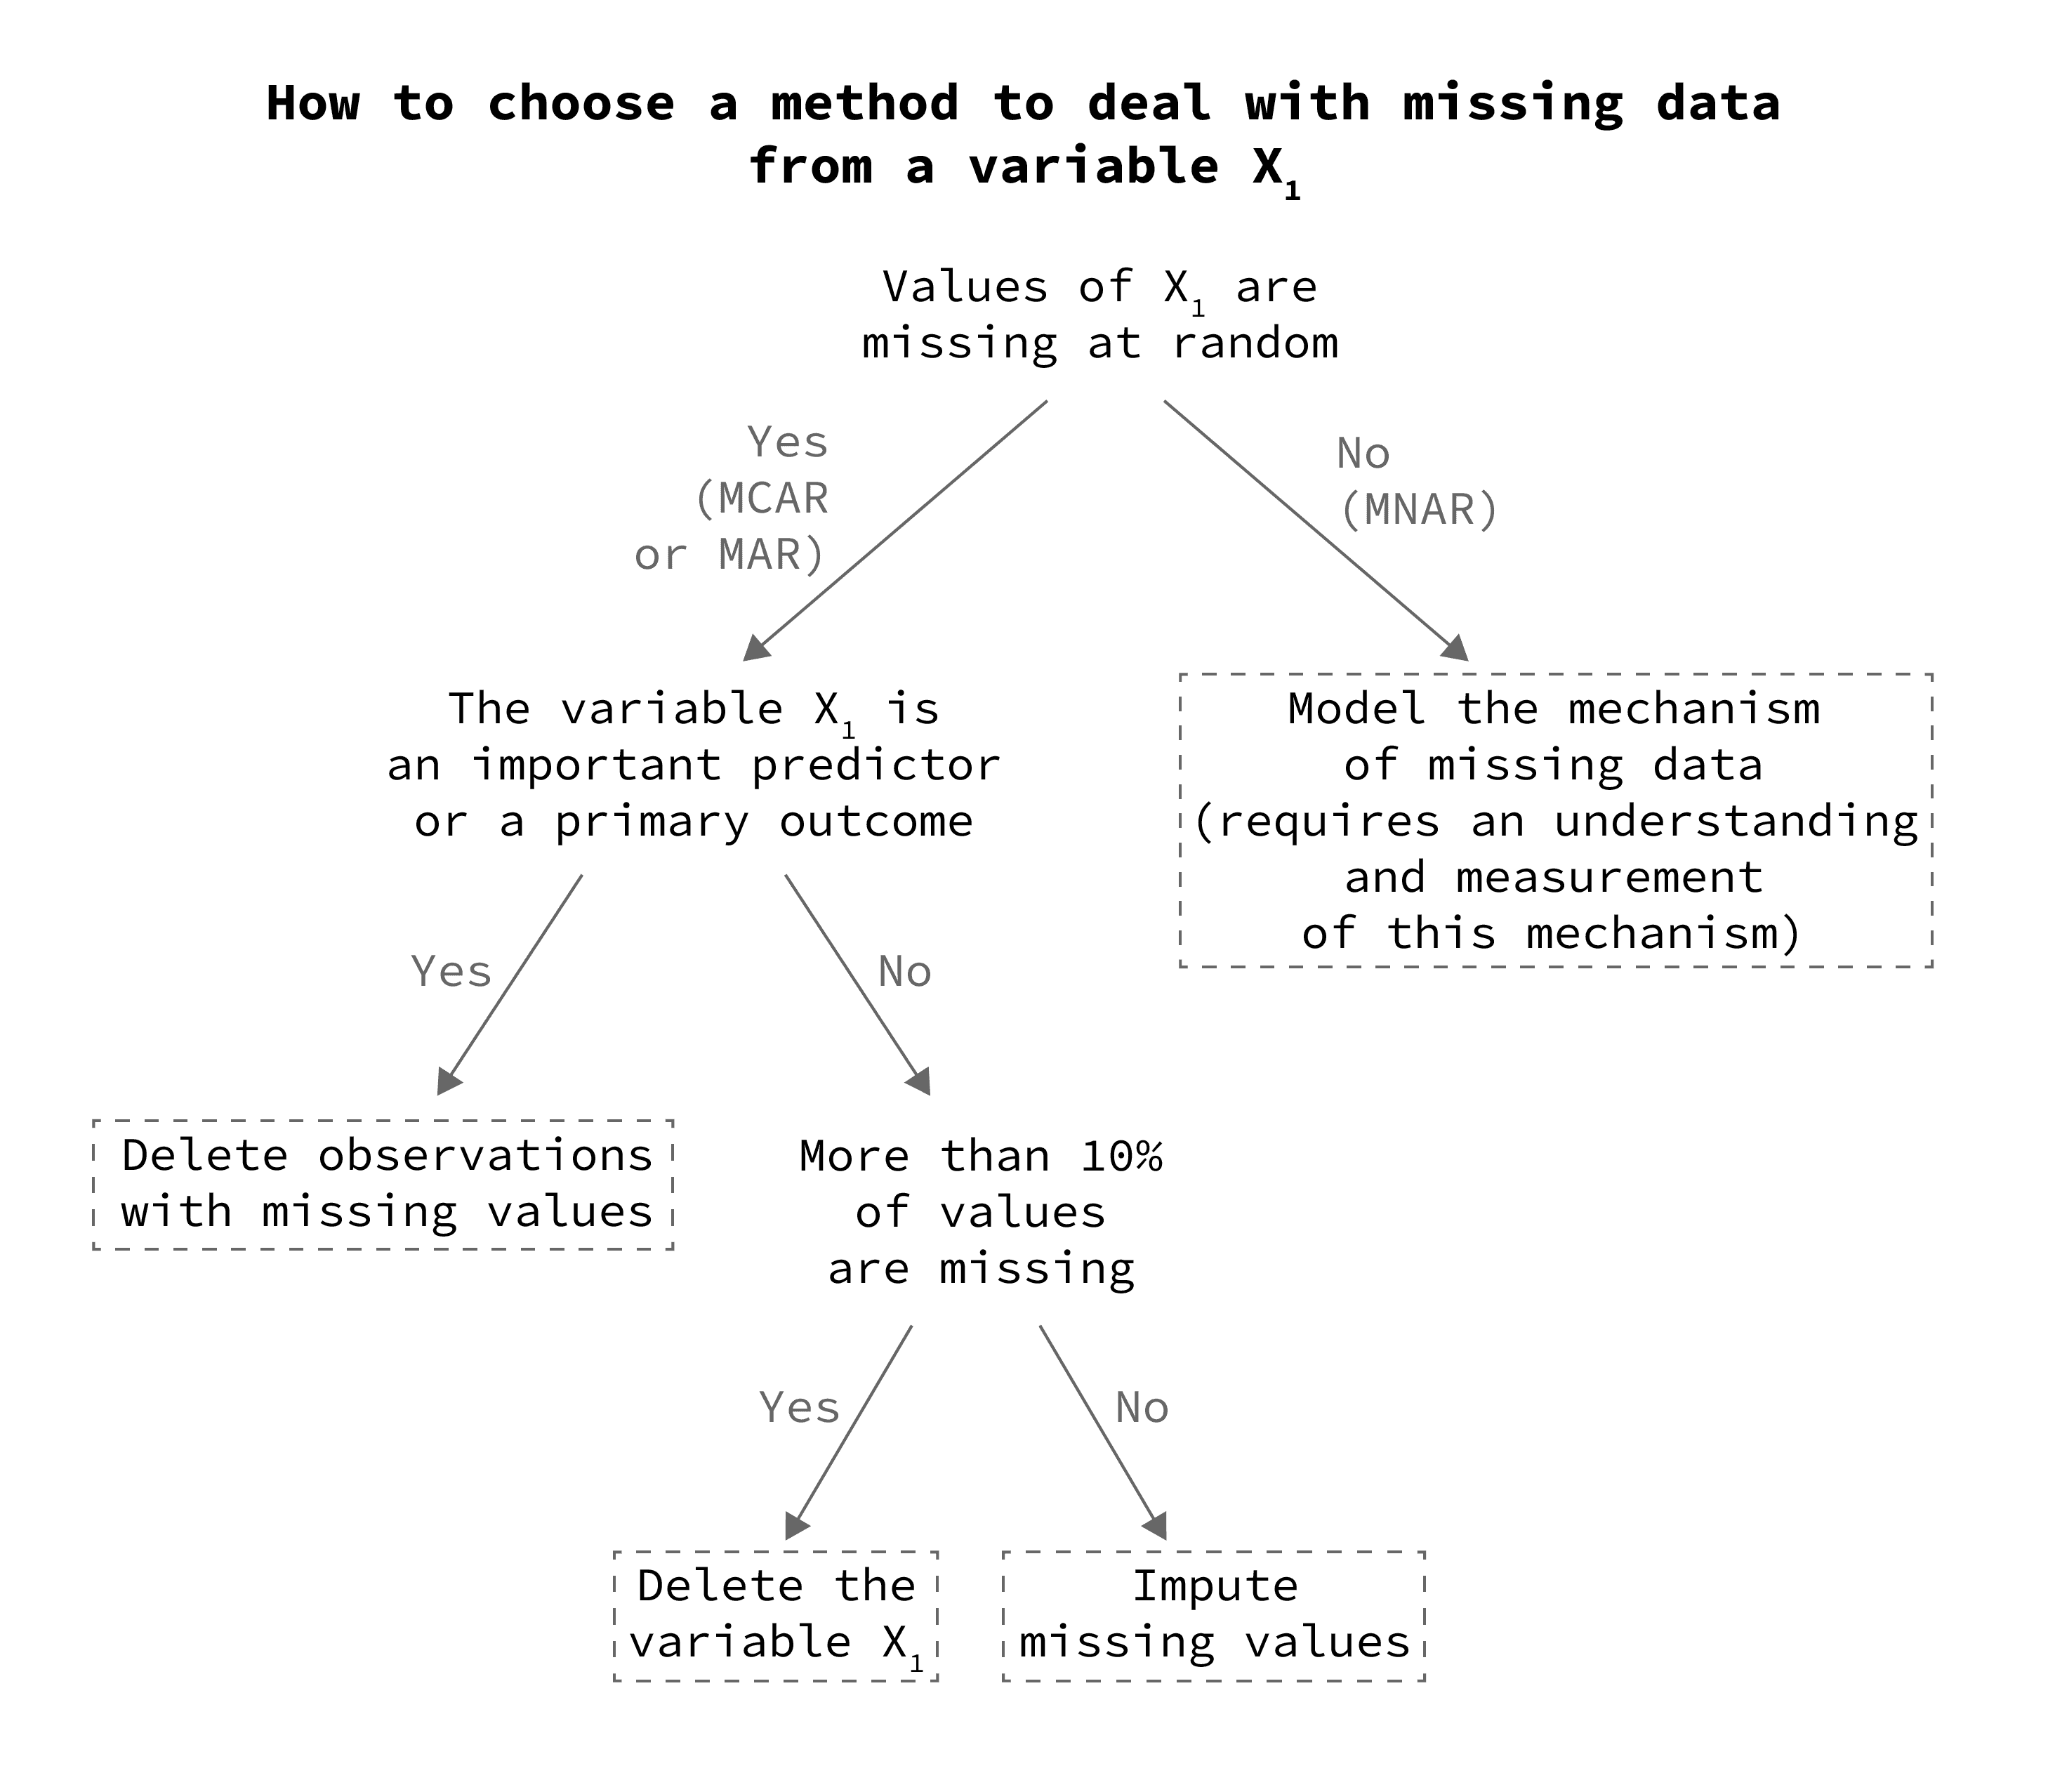
Note: This decision tree is based on Sainani K.L., 2015 [see references below].
An example of handling missing data from a survey
The following table represents the first 10 rows of our sample dataset:
| Index | Age | Smoking | Urinary tract infection |
|---|---|---|---|
| #1 | 20 | Yes | No |
| #2 | 45 | Yes | ❌ |
| #3 | ❌ | ❌ | No |
| #4 | 72 | No | ❌ |
| #5 | 18 | ❌ | No |
| #6 | 25 | ❌ | Yes |
| #7 | 64 | ❌ | No |
| #8 | 48 | Yes | Yes |
| #9 | 19 | No | No |
| #10 | 27 | No | Yes |
Step 1: Determining the type of missing data
For each variable in our dataset, we will use the first decision tree above to determine the reason why the data are missing:
Type of missing values in Age
Hint: Age was calculated by the researcher using the date of birth obtained from the participants’ ID cards.
Reasoning: Because age was obtained from an unbiased source, missing values in this variable are probably the result of mistakes in data entry. In other words, we have no reason to believe that the researcher tends to hide the age of some particular participants intentionally.
Conclusion: The missing values in Age are missing completely at random (MCAR).
Type of missing values in Smoking
Hint: Information about the participants’ smoking status was obtained from the study questionnaire.
Reasoning: Considering that adolescents might want to hide the fact that they smoke, young smokers will tend to have more missing values in this variable. So, missingness in smoking is related to the value of the variable itself and to another variable in the data, which is age.
Conclusion: If this is true, then we can say that the missing values in Smoking are missing not at random (MNAR).
Type of missing values in Urinary tract infection
Hint: Information about whether a participant suffered from a urinary tract infection in the past year was obtained from the study questionnaire.
Reasoning: We have no good reason to believe that certain participants will tend to hide information about their history of past infections, so we can assume that missing values in this variable are not related to the values themselves. On the other hand, older adults may be more likely to forget such information, and therefore would be more likely to leave the answer blank, so the likelihood of having a missing value in this variable is related to another variable in the data, which is age.
Conclusion: The missing values in Urinary tract infection are missing at random (MAR).
Step 2: Choosing a method to deal with missing values from each variable
Before choosing the method to deal with missing values, we must:
- Determine the types of missing values in our dataset (which is what we did in step 1 above).
- Determine the importance of each variable in our dataset (for this, we need to know the objective of the study, i.e. the question that we are trying to answer from our data).
Suppose that the objective of our study is to find risk factors/predictors of urinary tract infection.
In this case:
- Urinary tract infection is the outcome: an essential variable
- Age certainly is a strong predictor of that outcome: another essential variable
- Smoking is a weak predictor of the outcome (according to previous studies on the subject): therefore not an essential variable.
Here’s a summary of our analysis so far:
| Variable | Type of missing data | Essential variable |
|---|---|---|
| Age | MCAR | Yes |
| Smoking | MNAR | No |
| Urinary tract infection | MAR | Yes |
Using this table with the second decision tree above, we can determine the best method to deal with missing values in these 3 variables:
Dealing with missing values in Age
Since Age is an essential MCAR variable, we will delete observations with missing values, such as observation #3:
| Index | Age | Smoking | Urinary tract infection |
|---|---|---|---|
| #1 | 20 | Yes | No |
| #2 | 45 | Yes | ❌ |
| #3 | ❌ | ❌ | No |
| #4 | 72 | No | ❌ |
| #5 | 18 | ❌ | No |
| #6 | 25 | ❌ | Yes |
| #7 | 64 | ❌ | No |
| #8 | 48 | Yes | Yes |
| #9 | 19 | No | No |
| #10 | 27 | No | Yes |
Dealing with missing values in Smoking
Since Smoking is MNAR, we cannot delete observations or impute its missing values (otherwise, we will introduce bias).
In this case, we have 2 options:
- Since this variable is not an essential predictor, and if the percentage of missing values is above 10%, we can delete the variable altogether.
- Another option will be to restrict our analysis to only include participants who are 20 years of age or above, and consider the population of interest to be all adults above 20. This can work because earlier we argued that bias from this variable is only present for adolescent participants (age ≤ 19).
So, we will delete rows #5 and #9 from the table above:
| Index | Age | Smoking | Urinary tract infection |
|---|---|---|---|
| #1 | 20 | Yes | No |
| #2 | 45 | Yes | ❌ |
| #3 | ❌ | ❌ | No |
| #4 | 72 | No | ❌ |
| #5 | 18 | ❌ | No |
| #6 | 25 | ❌ | Yes |
| #7 | 64 | ❌ | No |
| #8 | 48 | Yes | Yes |
| #9 | 19 | No | No |
| #10 | 27 | No | Yes |
Once our analysis is restricted to participants aged 20 or above, we can impute the rest of the missing values of Age since they are no longer (MNAR).
Imputation can be done by replacing missing values with the most common value of Smoking, by using regression imputation, or multiple imputation.
Dealing with missing values in Urinary tract infection
Urinary tract infection is an essential MAR variable, therefore, the best strategy is to delete observations with missing values, such as row #2 and #4:
| Index | Age | Smoking | Urinary tract infection |
|---|---|---|---|
| #1 | 20 | Yes | No |
| #2 | 45 | Yes | ❌ |
| #3 | ❌ | ❌ | No |
| #4 | 72 | No | ❌ |
| #5 | 18 | ❌ | No |
| #6 | 25 | No | Yes |
| #7 | 64 | Yes | No |
| #8 | 48 | Yes | Yes |
| #9 | 19 | No | No |
| #10 | 27 | No | Yes |
Now that we are left with all complete cases, we can carry on with our statistical analysis to answer the study objective.
References
- Sainani, K. L. (2015). Dealing With Missing Data. PM & R: The Journal of Injury, Function, and Rehabilitation, 7(9), 990–994. https://doi.org/10.1016/j.pmrj.2015.07.011
- Kabacoff, R. I. (2022). R in Action, Third Edition: Data analysis and graphics with R and Tidyverse (3rd edition). Manning.