Protopathic bias occurs when an exposure is initiated (or stopped) in response to a symptom of the disease (outcome) which is not yet diagnosed. This leads to a false conclusion on the causal relationship between exposure and outcome.
This bias is especially known in pharmacoepidemiological studies where:
- The exposure is the prescription of a medication
- The outcome is a disease
Protopathic bias can occur in 1 of 2 ways, here’s a step-by-step explanation of how this can happen:
1- Either an exposure is INITIATED in response to a symptom of the undiagnosed disease, then:
- After some time the disease will be diagnosed
- The exposure will seem to precede the disease
- We will falsely conclude that the exposure caused the disease
2- Or an exposure is DISCONTINUED in response to a symptom of the undiagnosed disease, then:
- After some time the disease will be diagnosed
- Avoidance of the exposure will seem to precede the disease
- We will falsely conclude that the exposure is protective against the disease
Protopathic bias affects observational studies where the choice of who gets the exposure and who doesn’t is not randomized.
It works by falsely reversing cause and effect — a phenomenon called reverse causation.
Examples of protopathic bias
In this section we will travel back to 1980 to study 2 examples:
- Where a drug is prescribed in response to early symptoms of a disease.
- Where a drug is discontinued in response to early symptoms of a disease
The examples below were discussed in The Problem of “Protopathic Bias” in Case-Control Studies, 1980.
1. Estrogen prescription influenced by endometrial cancer symptoms
This was a case-control study that included:
- A case group: women who had endometrial cancer
- A control group: women with diagnoses other than uterine cancer
Controls were matched on age and race with each member of the case group.
Data about the exposure to estrogen AND the reason for that indication were collected.
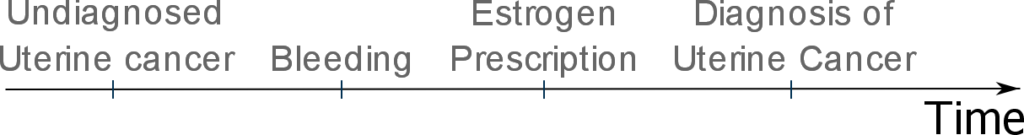
The results show that many of these women were prescribed estrogen and some were in response to uterine bleeding which is a symptom of cancer:

In this case, protopathic bias can occur as estrogen use precedes the diagnosis of uterine cancer and thus appears to cause uterine cancer:
To study the effect of protopathic bias, the investigators decided to calculate 2 odds ratios for the relationship between estrogen prescription and uterine cancer:
- The first including cases and controls for whom estrogen was prescribed to treat uterine bleeding
- The second excluding this group
By excluding the group to whom estrogen was prescribed to treat uterine bleeding from their analysis, the authors were able to remove the influence of protopathic bias.
Indeed, their results show a drop of 10% of the odds ratio when the influence of protopathic bias was removed.
This stratified analysis that we just described is important for 2 reasons:
- It verifies the presence of protopathic bias: by showing that estrogen prescription may be influenced by symptoms of endometrial cancer
- It quantifies the effect of protopathic bias: in this case it was an increase of 10% in the odds ratio
2. Discontinuation of oral contraceptives in response to early symptoms of benign breast disease
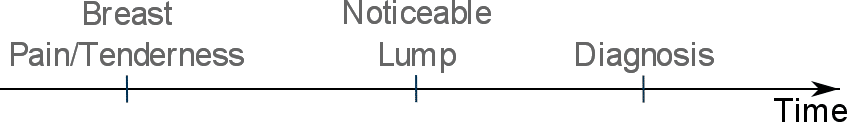
Early symptoms of benign breast disease may include breast pain and tenderness.
Over time, a discernible lump may be noticed leading to diagnosis of benign breast disease:
These early benign breast disease symptoms (such as breasts pain and tenderness) may be considered by medical doctors as potential contraindications for:
- Initiating oral contraceptive use
- Continuing oral contraceptive use
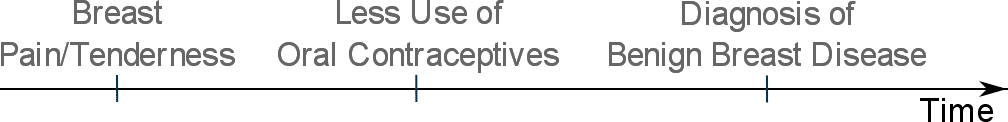
Janerich et al. found that significantly more women with benign breast disease were advised by their physicians to discontinue oral contraceptives for reasons related to breast complaints:

And because less oral contraceptives use will precede the diagnosis of benign breast disease, oral contraceptive use will appear to be less associated with benign breast disease:
This will lead to protopathic bias as we might falsely believe that oral contraceptives are protective against benign breast disease.
How to avoid protopathic bias
If we have some reason to believe that symptoms of a yet undiagnosed disease may influence the exposure, then we must take some protective measures to avoid protopathic bias.
Protopathic bias can be dealt with in 2 ways:
1. By excluding the group of individuals who were exposed in response to symptoms of the yet undiagnosed outcome
This can be done by running the analysis twice (i.e. calculating 2 odds ratios as we saw in example #1 above):
- One including cases who were prescribed the drug in response to symptoms of the undiagnosed disease
- And one excluding this group
And then comparing results from both analyses to identify and quantify protopathic bias.
This approach is limited by our ability to identify the group of participants who received the exposure in response to symptoms of the yet undiagnosed outcome, which is not always possible.
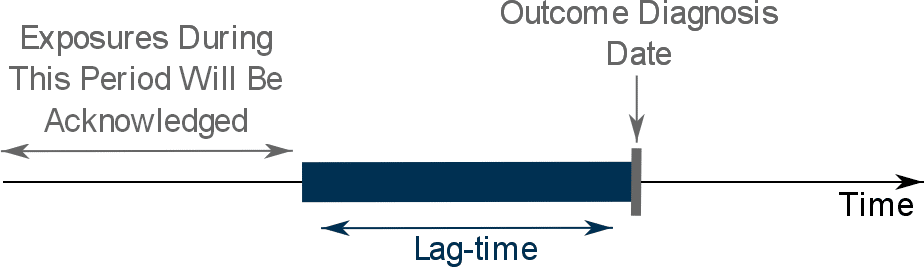
2. By applying a lag-time into the exposure definition
This approach involves the exclusion from the assessment of exposure of a specific period of time before the diagnosis date.
In simple terms, we will ignore all exposures that occur during the lag-time:
What is the best lag-time to be applied?
Unfortunately, there is no single answer to this question as this depends much on the disease being studied.
Specifically, can you estimate the period of time during which the disease/outcome can go unnoticed while presenting some symptoms that can influence the exposure?
If you cannot, you’re basically left with 2 options:
- Either to apply the same lag-time used in previous similar studies (if such studies exist)
- Or determine the lag-time analytically using data from your own study
What is the big deal about choosing the right lag-time?
Choosing an near-optimal lag-time is important as:
- A shorter than optimal lag-time will lead to incomplete control of protopathic bias
- And a longer lag-time will lead to excluding exposures that may be causally associated with the outcome
A method for determining the lag-time using your own study data involves slightly complex statistical methods and is explained in details in Tamim et al.
However, I will provide a brief overview of this method:
First we calculate the odds ratios of the association between exposure and outcome for different values of the lag-time.
Then we plot them as shown below:
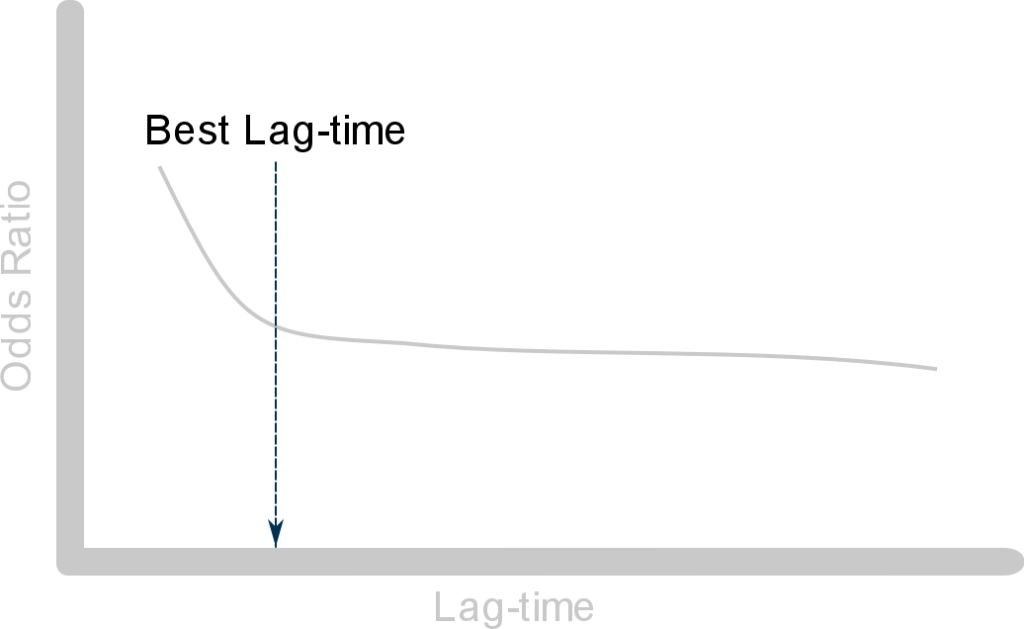
From this plot we can see that:
- The odds ratio first declines as the lag-time gets bigger: this is to be expected when the exposure is associated with early symptoms of the outcome — this is due to protopathic bias
- Then the slope of the curve stabilizes as we increase the lag-time period: here the curve approaches the true unbiased value of the odds ratio
The point at which the curve starts to stabilize is the best lag-time to be used in the study. And the odds ratio calculated using this value of the lag-time is considered unaffected by protopathic bias.